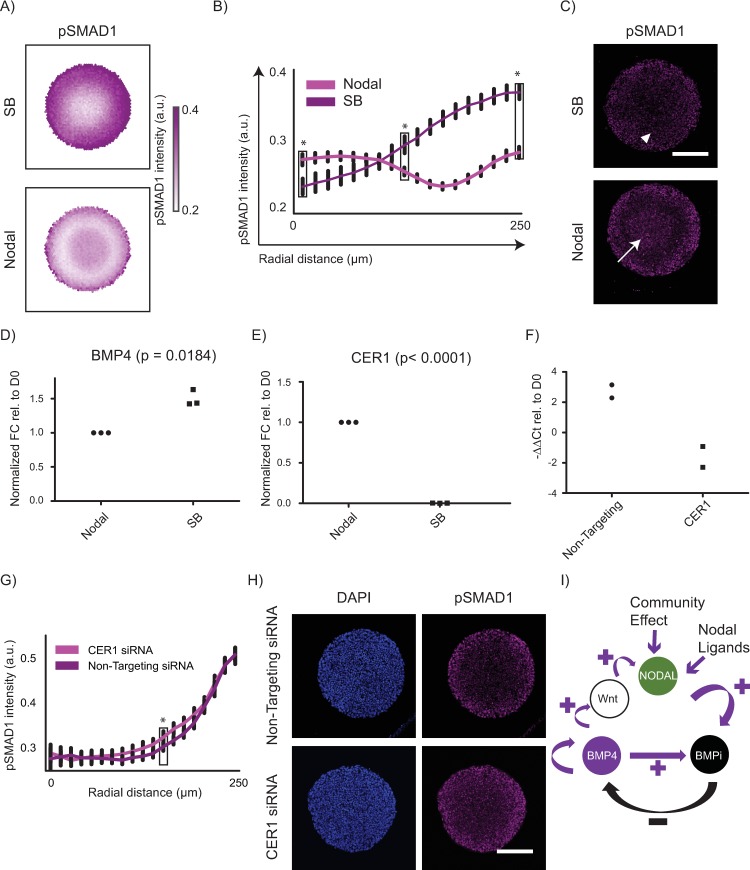
Fig 5. Nodal signalling contributes to the formation of the pSMAD1 gradient.
(A–C) Perturbing Nodal signalling results in a significant change in the pSMAD1 organized gradient formation. (A) Average pSMAD1 intensity detected with colonies were treated with 25 ng/ml of BMP4 for 24 h either in the presence of Nodal or SB represented as overlays of 188 and 163 colonies for Nodal and SB conditions, respectively. Data pooled from 2 experiments. (B) The average radial trends of pSMAD1 for SB and Nodal conditions when treated with 25 ng/ml of BMP4 shown as line plots. SDs shown in black. The p-values were calculated using Mann-Whitney U test. *p < 0.0001. Underlying numerical data for this figure can be found in the file Fig 5B in OSF repository in the project named after the paper title. (C) Representative immunofluorescence images of 500 μm diameter hPSC colonies stained for pSMAD1 after 24 h of BMP4 treatment (25 ng/ml) in ‘Nodal’ and ‘SB’ conditions (average response shown in panel A). Scalebar represents 200 μm. White arrows indicate regions where second peak of pSMAD1 appears. White triangles indicate regions of discernable pSMAD1 levels that appear to be lower than the levels at the colony periphery. (D–E) Changes in the activator and antagonists of BMP signalling upon perturbation of Nodal signalling. (D) BMP4 expression after 24 h of treatment of hPSCs with BMP4 containing media supplemented with either Nodal or SB. (E) CER1 expression after 24 h of treatment of hPSCs with BMP4 containing media supplemented with either Nodal or SB. Data in panels D and E represent 3 biological replicates and are shown as normalized (with respect to the expression observed in Nodal supplemented media) fold change relative to the Day 0 hPSC population for each biological replicate. The p-values were calculated using two-sided paired t-test. (F–H) siRNA mediated inhibition of CER1 increases the level of pSMAD1 detected in an interior band of the hPSC colonies when treated with BMP4 and Nodal. The experiments described in panels F through H were repeated twice. (F) CER1 expression controls for the 2 experiments in panels G and H showing a change in the levels of CER1 transcripts detected in the presence of a CER1 siRNA or a nontargeting siRNA. (G) Average radial trends of pSMAD1 for CER1 siRNA (45 colonies) and nontargeting siRNA (37 colonies) conditions shown as line plots. SDs shown in black. The p-values were calculated using Mann-Whitney U test. *p < 0.0001. (H) Representative immunofluorescent images of observed pSMAD1 staining for the condition when the colonies were treated with a CER1 siRNA versus a nontargeting siRNA. (I) Model of involvement of Nodal in the contribution to the pool of BMP signalling antagonists that govern the RD response observed in the BMP signalling pathway. BMP4 activates itself and its inhibitors like Noggin. In addition to Nodal signalling activating in the experiments because of the Nodal ligands present in the induction medium, BMP4 can also activate Nodal through Wnt, or Nodal can be induced because of a community effect in dense cultures. Nodal in turn can activate downstream targets like CER1 that are BMP antagonists, which contribute to a pool of BMP antagonists ‘BMPi’ that together antagonize BMP signalling. Underlying numerical data for this figure can be found in https://osf.io/zrvxj/. BMP4, bone morphogenetic protein 4; CER1, Cerberus; hPSC, human pluripotent stem cell; OSF, open science framework; pSMAD1, phosphorylated SMAD1; RD, reaction-diffusion; SB, SB431542 (Nodal signalling antagonist); siRNA, small interfering RNA.

