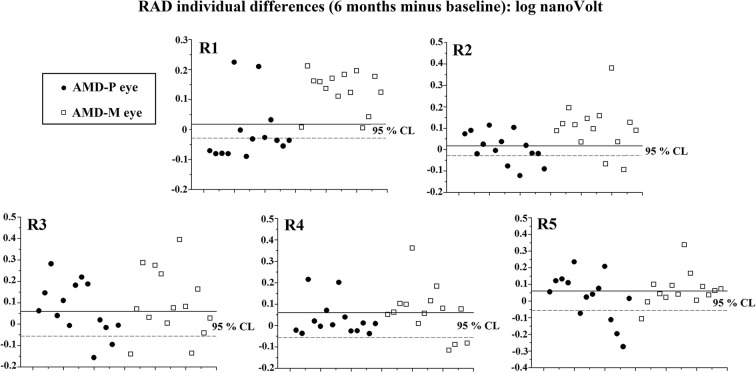
Fig. 2.
Individual changes after 6-month follow-up with respect to baseline of multifocal electroretinogram (mfERG) R1–R5 N1–P1 response amplitude density (RAD) values observed in AMD eyes treated with placebo (AMD-P eyes) or treated with Macuprev® (AMD-M eyes). R1–R5 refers to localized mfERG responses averaged in five eccentricity areas between the fovea and mid-periphery: 0–2.5° (R1), 2.5–5° (R2), 5–10° (R3), 10–15° (R4), and 15–20° (R5). The percentage of unmodified eyes (within the 95% confidence test–retest limit—values within solid and dashed line), eyes with improvement (values over the 95% confidence test–retest limit—solid line), and eyes with worsening (values under the 95% confidence test–retest limit—dashed line) are reported in Table 2

