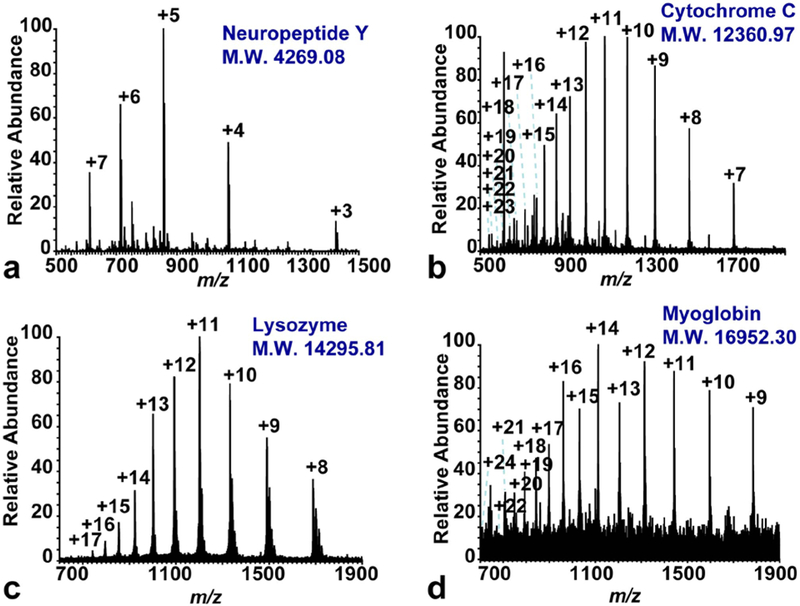
Figure 2. HRAM full scan spectra of intact peptide and protein standards: 1.0 μM neuropeptide Y (a), 1.0 μM cytochrome C (b), 1.5 μM lysozyme (c) and 3.0 μM myoglobin (d).

The molecular weight (M.W.) of each standard was shown in the figure. The m/z range of each spectra was chosen based on each sample in order to reveal all detected charge states.
