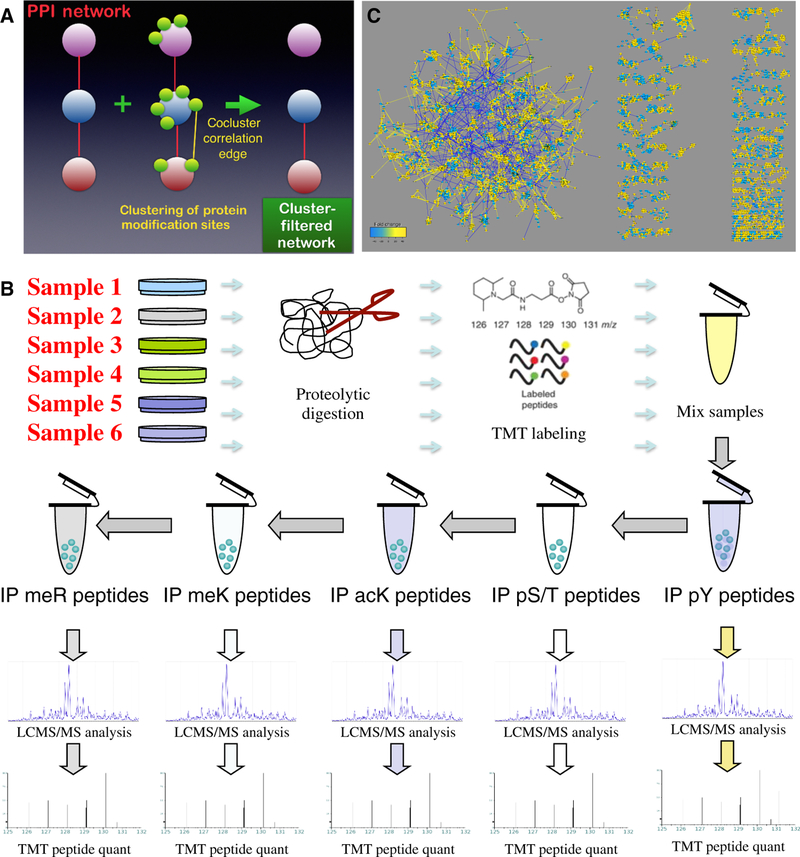
Figure 1. Data acquisition and analysis.
(A) A cluster-filtered network (CFN) was created by using a machine learning, pattern recognition algorithm (t-SNE) to identify which posttranslational modifications (PTMs) clustered together, filtering protein-protein interactions (PPIs; red edges) to retain only those between proteins whose PTMs co-clustered. (B) Outline of TMT mass spectrometry coupled with immunoprecipitation using modification-specific antibodies. Phospho-Ser/Thr (S/T) peptide immunoprecipitation was accomplished in multiple steps with AGC/PSD-family kinase substrate, AKT substrate, AMP kinase substrate, and ATM/ATR substrate antibodies (see Materials and Methods). Phosphopeptides were also further purified on a TiO2 column (82). (C) Bird’s-eye view of the co-cluster correlation network (CCCN) derived from posttranslational modifications from 15 independent experiments, each with 6 multiplex samples, from comparison of 45 lung cancer cell lines (12 derived from SCLC and 33 from NSCLC) to normal lung tissue, and selected cell lines treated with anti-cancer drugs. This disconnected network includes threshold-filtered Spearman correlations among t-SNE-clustered PTMs (yellow edges are positive correlations; blue are negative correlations). Also shown are negative correlations among different modification types within the same protein, which are useful for revealing antagonistic relationships among PTMs. Node size and color reflects total of all PTM ratios in the data set (fold change key). This network is available for download as Supplementary File 1, and on the NDEx repository (https://doi.org/10.18119/N9F59Z). This network combined with the CFN that contains filtered PPI edges may be explored at https://cynetworkbrowser.umt.edu/.

