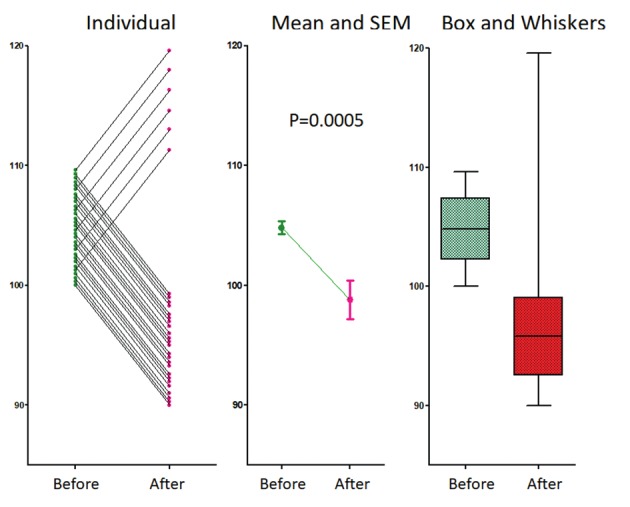
Figure 1.

A data set with 24 women decreasing and 6 increasing pain by 10% after treatment. Heterogeneity of response is obvious when the individual data are plotted but hidden when only means and SEM are given. The variability in response is suggested by box and whiskers plots. Students paired and un-paired t tests and Mann-Whitney results in P=0.0009, P=0.0004 and 0.0001 respectively.
