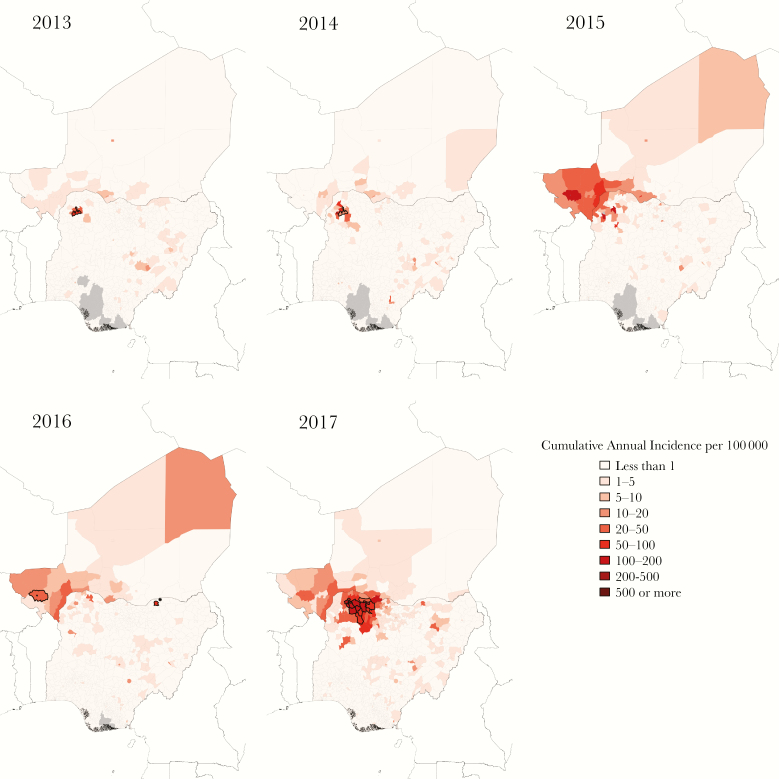
Figure 1.
Cumulative annual district-level incidence of suspected cases of meningitis in Niger and Nigeria 2013 to 2017. Centers of significant clusters of high incidence by Anselin’s local Moran’s I outlined in black. High-incidence outlier in 2016 indicated with asterisk. Gray areas represent districts for which no data are reported.

