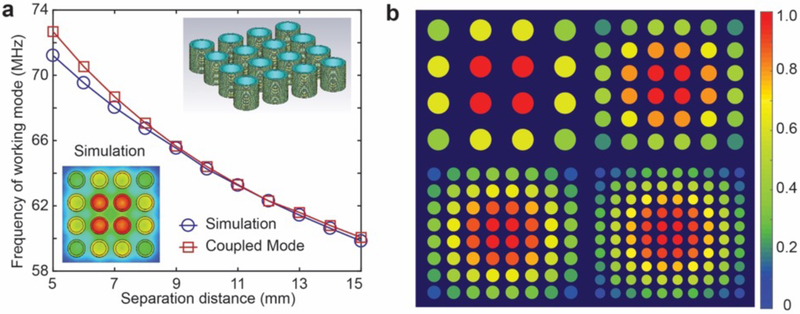
Fig. 3. Resonant mode of the metamaterials.
(a) The frequency of the working mode of the metamaterial as a function of separation distance of unit cells. Inset on the bottom left plots the simulated magnetic field at the middle cross section of the metamaterials. Inset on the top right depicts the model used for simulation. (b) The resonant strength derived from the coupled mode theory for metamaterials with 4 × 4, 6 × 6, 8 × 8, and 10 × 10 arrays. The resonant strength is normalized to the maximum value.

