Figure 1. Demographics of survey respondents.
(A) Distribution of responses by field of study and career stage. Of a total of 498 respondents, 488 were categorized as an early career researcher (ECRs; n = 407/488; 83%) or principal investigator (PIs; n = 81/488; 17%). Of these, 76% were in the life sciences (318 ECRs; 52 PIs), 13% were in the physical sciences (53 ECRs; 9 PIs), 9% were in the social sciences (31 ECRs; 14 PIs), and 2% were in the humanities/other (5 ECRs; 6 PIs). 10 respondents were neither ECR nor PI (e.g., “unemployed”; data not shown). (B) Distribution of responses by gender: 54% (271/498) of respondents were female, 43% (216/498) were male, and 3% (11/498) provided another or no response. (C) Distribution of responses by race/ethnicity: Of the 481 respondents who provided an answer to this question, 71% (342/481) were coded as white, 18% (84/481) Asian, and 11% (55/481) URM (underrepresented minority in the sciences).
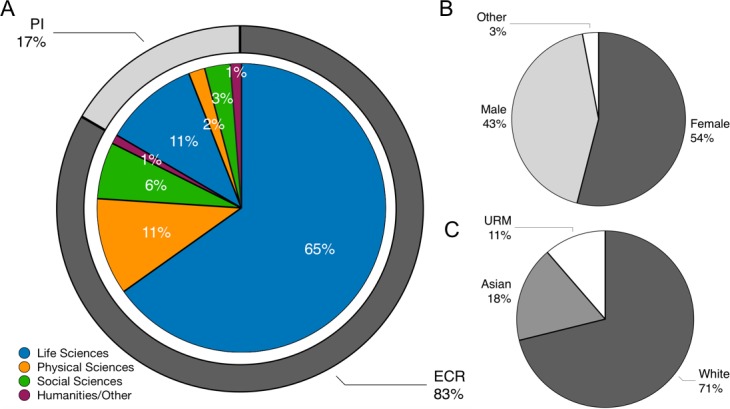
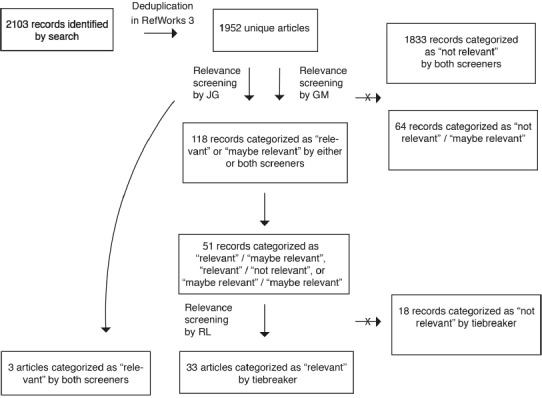
Figure 1—figure supplement 1. Search strategy for literature review with number of records remaining at each stage.