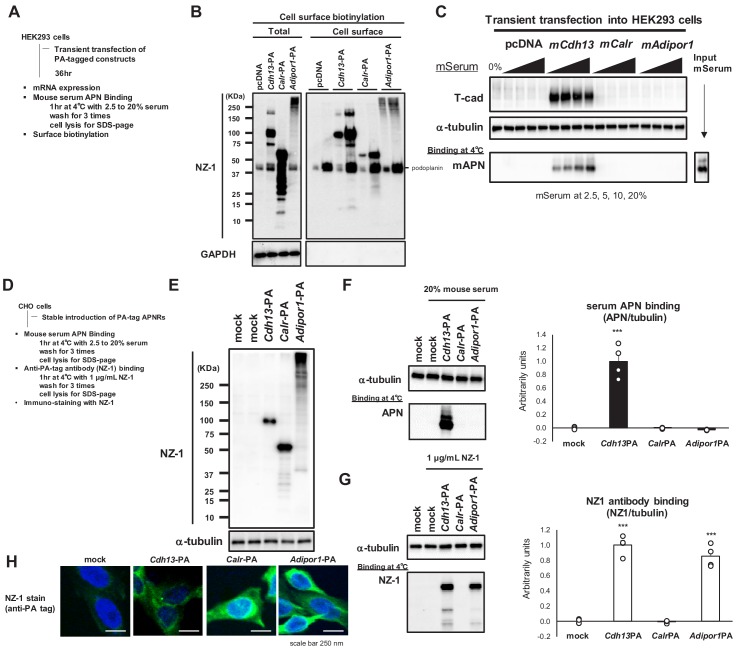
Figure 2. Cell surface expression of adiponectin receptors.
(A) Experimental outline of transient expression in HEK293 cells. (B) Surface protein biotinylation analysis. Cell surface biotinylated proteins trapped on Streptavidin beads were eluted and analyzed in SDS-page in two lanes; x1 and x5 concentrations. Note that PA-tag antibody NZ-1 react with human podoplanin (40 KDa) in addition to PA-tagged proteins. GAPDH; control cytosolic protein. (C) Binding of mouse adiponectin in mouse serum (MS) to HEK293 cells. (D) Experimental outline of stable CHO cells expressing adiponectin receptors. (E) stable expressions detected by NZ-1. (F) Binding of mouse adiponectin in mouse serum to CHO cells. Adiponectin-binding from western blots (left) was calculated and expressed in right graph. Data are mean ± SEM. n = 4 ***p<0.01 (unpaired t-test). (G) Binding of NZ-1 antibody to CHO cells. NZ-1-binding from western blots (left) was calculated and expressed in right graph. Data are mean ± SEM. n = 4 ***p<0.001 (unpaired t-test). (H) Confocal immunofluorescence micrographs of CHO cells stained with anti-PA tag antibody NZ-1 (green). Cell nuclei were counterstained with DAPI (blue). Scale bars = 250 nm.

