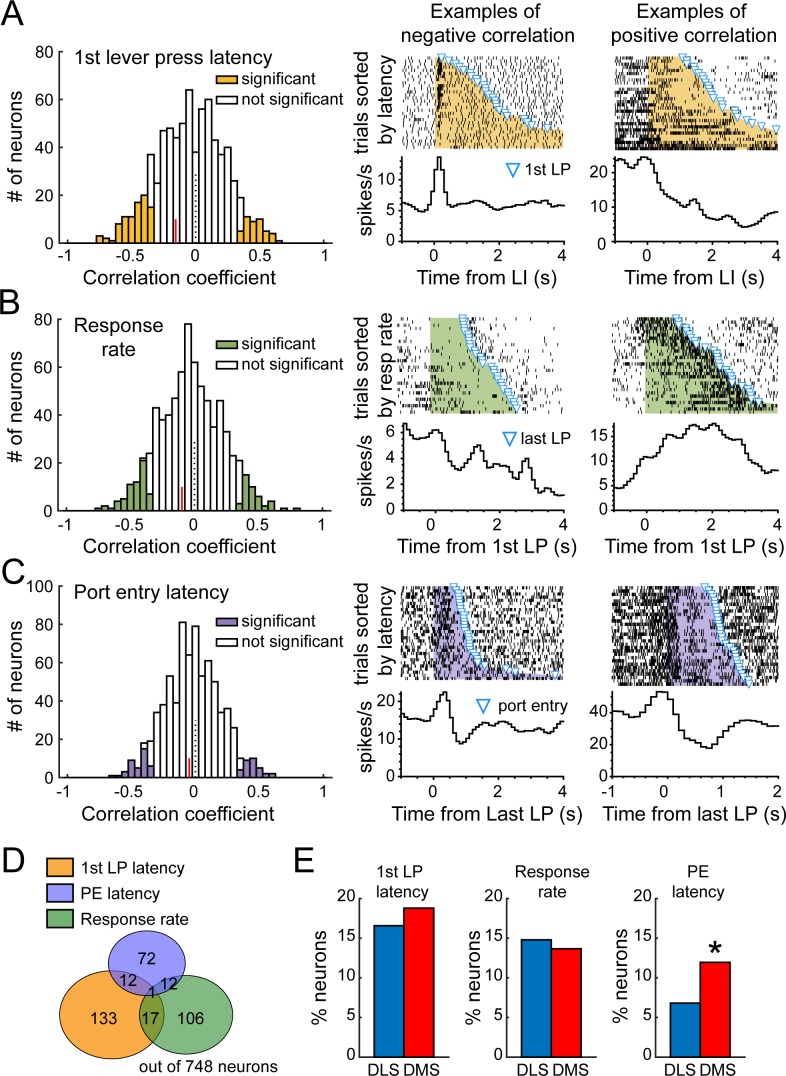
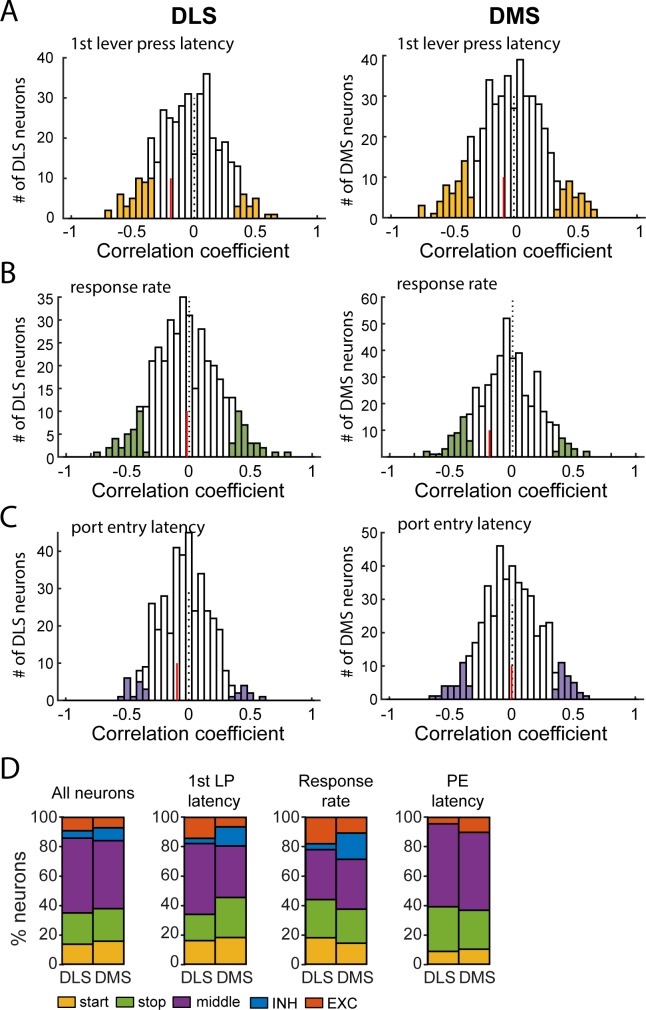
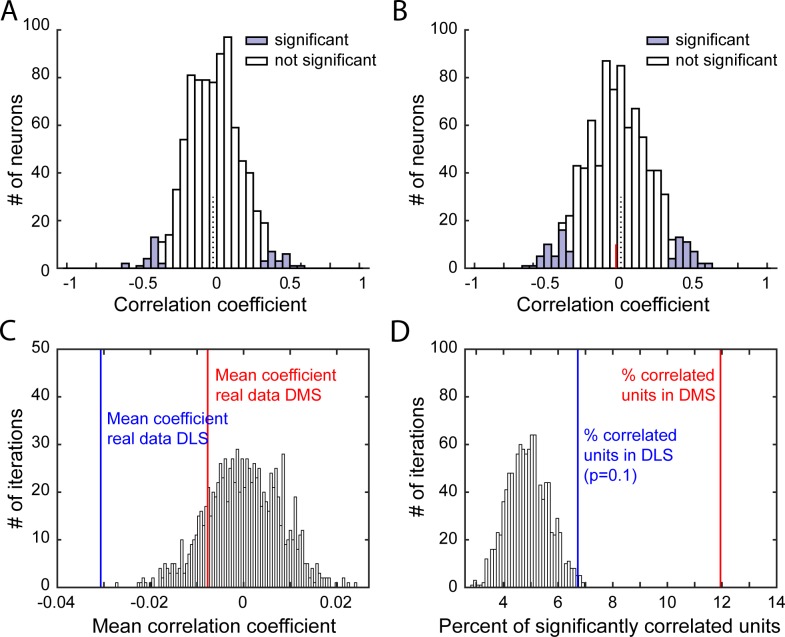
Figure 10. DLS and DMS neural activity correlates with over-trained task-performance during extended training.
(A) Left: Distribution of Spearman rank correlation coefficients relating firing rate after the lever insertion (0–500 ms) to the first lever press latency on a trial by trial basis. Example of neurons with a negative (middle) or positive correlation (right) between firing rate and latency. (B) Left: Distribution of Spearman rank correlation coefficients relating firing rate during the sequence (from first to last lever press) to the response rate on a trial by trial basis. Example of neurons with a negative (middle) or positive correlation (right) between firing rate and response rate. (C) Left: Distribution of Spearman rank correlation coefficients relating firing rate after the lever retraction (0–500 ms) to the port entry latency on a trial by trial basis. Example of neurons with a negative (middle) or positive correlation (right) between firing rate and port entry latency. Red lines on correlation coefficient histograms indicate the coefficient median of units significantly correlated. (D) Venn diagram illustrating the number of units with significant correlation between firing rate and 1st lever press latency (yellow), response rate (green) and port entry latency (blue). (E) Proportion of neurons in DMS and DLS expressing correlation with the 1st lever press latency (left), the response rate (middle), and the port entry latency (right).

