. 2019 Oct 17;8:e49536. doi: 10.7554/eLife.49536

Figure 2. DMS and DLS neurons are differentially modulated in the DT5 task during early training but not extended training.

(A) Proportion of non-task-responsive neurons (non-TRN), and task-responsive neurons (TRN) excited (EXC) or inhibited (INH) during the sequence, across early training sessions (left) or after extended training (right) in DLS (up) and DMS (bottom). (B–C) Mean z-score (± SEM) of DLS (blue) and DMS (red) TRNs during (B) early training sessions day 1 (top) and 10 (bottom) (N = 9 animals) and (C) during extended training (N = 8 animals). (D–E) Heatmaps of DLS (left) and DMS (right) TRNs, sorted by mean sequence-related activity, during (D) early training session 1 (top) and 10 (bottom) and (E) extended training.

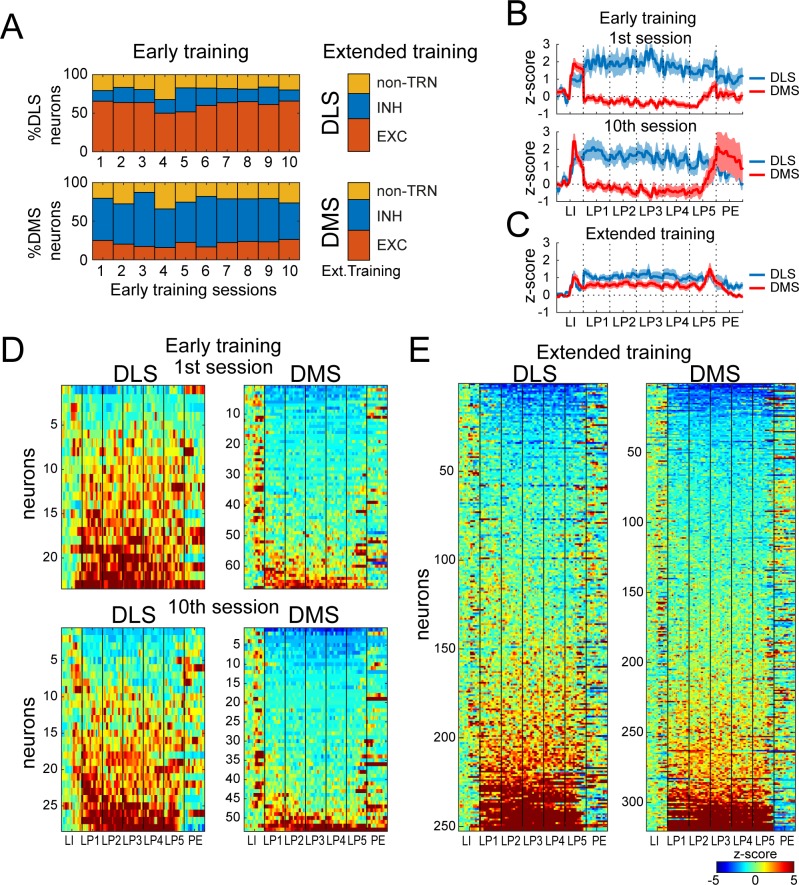
Figure 2.

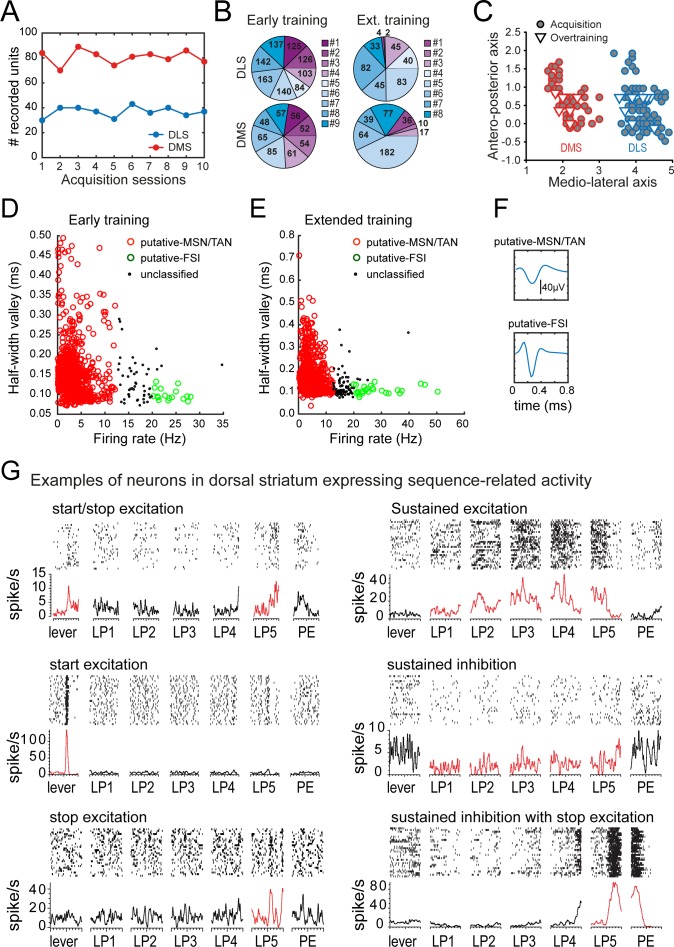
Figure 2—figure supplement 1. Recording results summary and isolation of medium spiny neurons.

Figure 2—figure supplement 1.

(A) Number of recorded units per session in DLS (blue) and DMS (red). (B) Total number of recorded units (sum across sessions) per rats in DLS (top) and DMS (bottom), during early training (left) and extended training (right). (C) Antero-posterior and medio-lateral coordinates of electrode placements in the early training (circle) and extended training (triangle) groups. (D–E). Scatter plots of firing rate and half-valley width in the early training (D) and extended training (E) data sets. (F) Example of the average waveform of putative MSN/TAN, and putative-FSI. (G) Rasters and peri-event time histograms are presented for eight neurons in the extended training data set expressing distinct neural activity patterns during the behavioral sequence (±500 ms windows around each event of the sequence).
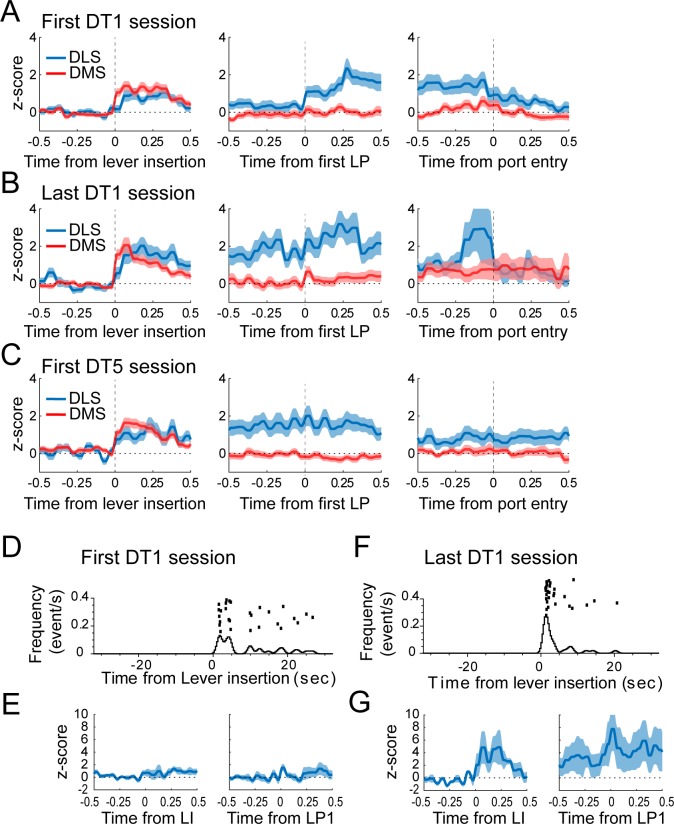
Figure 2—figure supplement 2. Moderate changes in DLS activity across the first DT1 early training sessions.

Figure 2—figure supplement 2.

(A–C) Average z-score (± SEM) of putative-MSNs around the lever insertion (left), the first lever press (middle), and the port entry (right) in DMS and DLS neurons during the first DT1 session (A), the last DT1 session (B), and the first DT5 session (C). DLS activity before the first lever press differs during the first DT1 session compared to the last DT1 session (p<0.05) and the first DT5 session (p<0.05). (D and F) Peri-event raster and histogram of lever presses aligned to the lever insertion (upper part) in the first DT1 session (D) and the last DT1 session (F) of a representative rat. (E and G) Mean z-score (± SEM) around the lever insertion (left) and the first lever press (right) in DLS neurons during the first DT1 session (E) and the last DT1 session (G) depicted in D and F.