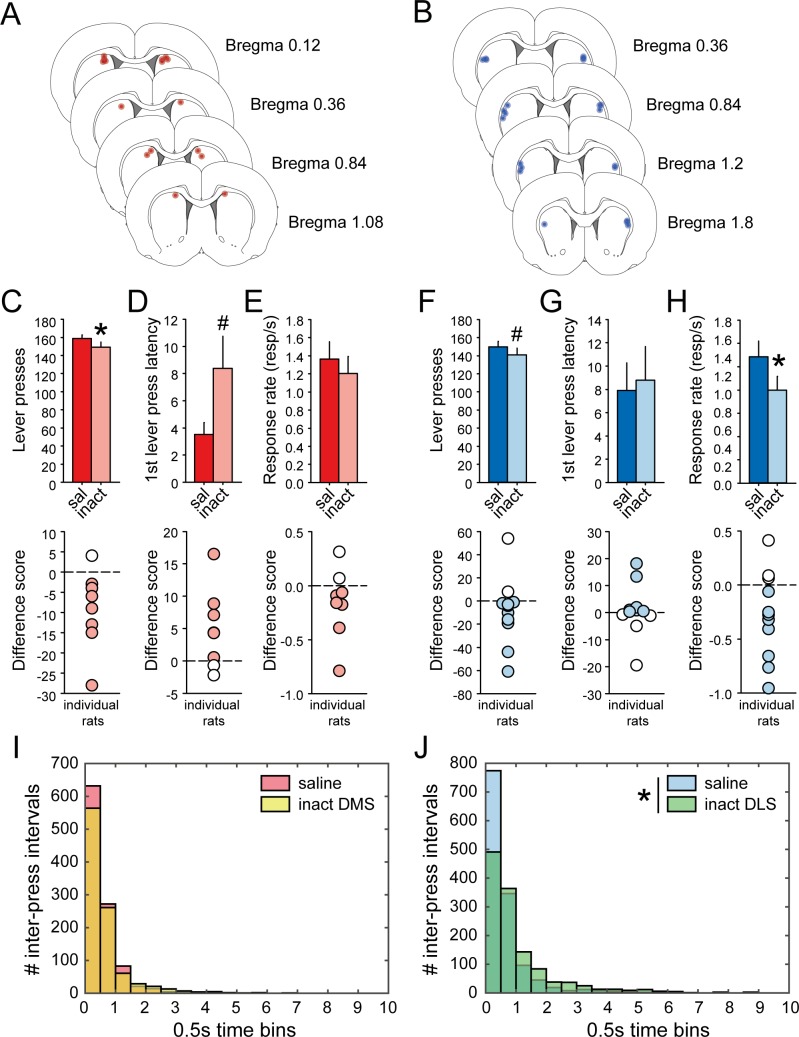
Figure 9. Pharmacological inactivation of DMS and DLS disrupts task-performance.
(A–B) Schematic representation of cannula placements in DMS (A) or DLS (B). (C–E) Mean number of lever presses (± SEM) (C) mean first lever press latency in seconds (± SEM) (D) and mean response rate (± SEM) (E) after infusion of saline or muscimol/baclofen in the DMS (top) and difference scores (inactivation – saline) of individual rats (bottom). (F–H) Mean number of lever presses (± SEM) (F), mean first lever press latency in seconds (± SEM) (G), and mean response rate (± SEM) (H) after infusion of saline or muscimol/baclofen in the DLS (top) and difference scores (inactivation – saline) of individual rats (bottom). (I–J) Distribution of inter-press intervals after infusion of saline (DMS, red; DLS, blue) or muscimol/baclofen (DMS, yellow; DLS, green) in the DMS (I) or in the DLS (J).

