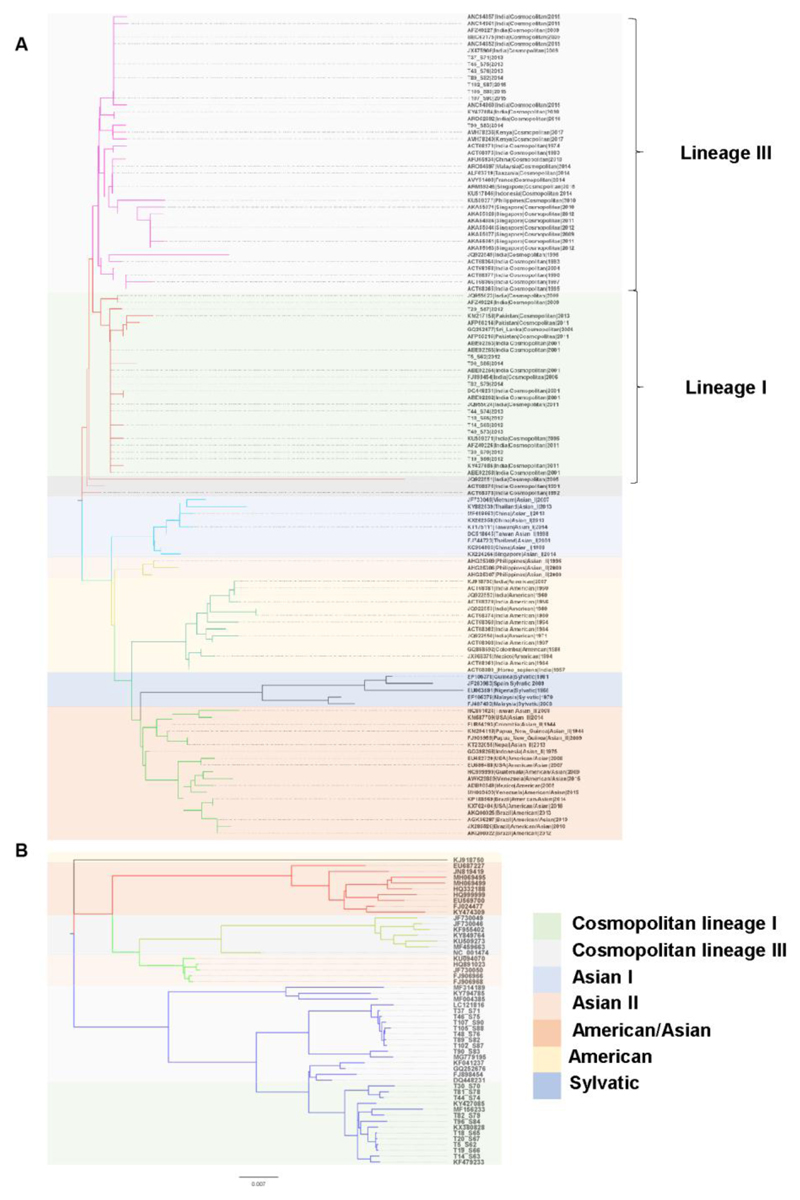
Figure 3.
Phylogenetics analysis of DENV-2 clinical isolates. A) The optimal tree with the sum of branch length = 0.43786479 is shown. The tree is drawn to scale, with branch lengths in the same units as those of the evolutionary distances used to infer the phylogenetic tree. The evolutionary distances are in the units of the number of amino acid substitutions per site. The analysis involved 121 amino acid sequences of the E protein. There were a total of 473 positions in the final dataset. B) Phylogenetic tree for whole genomes of dengue 2 virus using Maximum Likelihood method based on the General Time Reversible model. The tree with the highest log likelihood (-47856.75) is shown. The tree is drawn to scale, with branch lengths measured in the number of substitutions per site. The analysis involved 53 nucleotide sequences. There were a total of 10743 positions in the final dataset. Samples from this study are indicated as in Supplementary Table T3.

