
Fig. 2. Backed pieces from Grotta del Cavallo showing DIFs and MLITs, and sampling of residues on backed pieces by FTIR spectroscopy and its results.
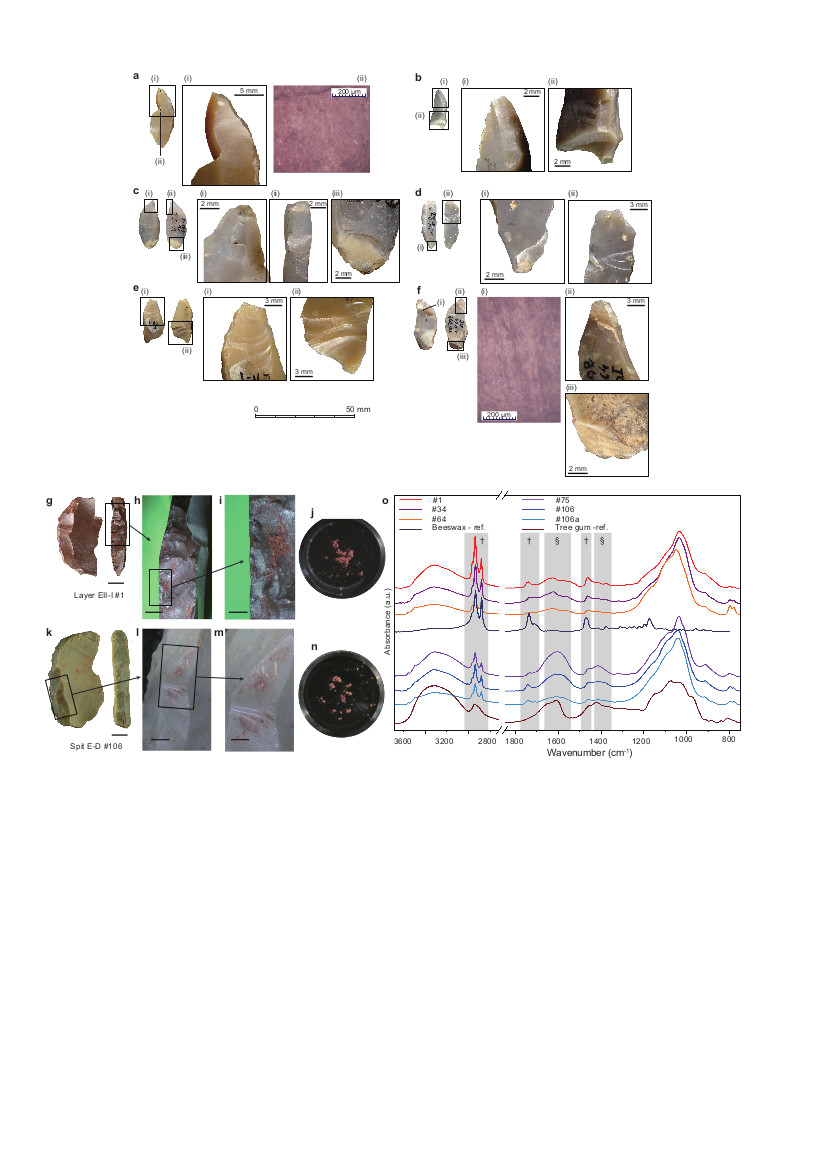
a, A simple DIF type a2. b–f, Multiple DIF type a2m. a(i), c(ii) and d(i) are burin-like fractures; b(i), c(i), and c(iii) are flute-like fractures; b(ii) is a step-terminating transverse fracture and a spin-off; e(i) and d(ii) are spin-offs; e(ii) is a step-terminating transverse fracture; f(ii) is flute- and burin-like fractures; f(iii) is a feather-terminating transverse fracture. a(ii), f(i) and the black lines in a and f are MLITs. b, c and e are from layer EII-I; a and d are from layer E-D; and f is from layer D. g, k, Optical images at two different angles of sample 1, layer EII-I (scale bar, 5 mm) and sample 106, spit E-D (scale bar, 5 mm). Sampled areas are highlighted by a black box and magnified in h and i for sample 1 (scale bars, 1 mm and 0.5 mm) and in l, and m for sample 106 (scale bars, 2 mm and 1 mm). j, n Optical images of the scraped residues sitting on the culet of the opened diamond compression cell. o, Representative FTIR spectra of the sampled residues from samples 1, 34, 64, 75, 106 and sample 100a. Two selected reference spectra of beeswax and peach tree gum are also plotted using the database from Kimmel Center for Archaeological Science Infrared Standards Library (https://www.weizmann.ac.il/kimmel-arch/infrared-spectra-library). The grey shaded areas indicate the main absorption bands, characteristic of the organic fraction. Among them, those relating to beeswax are marked with dagger symbols, and those relating to plant/tree gum are marked with section symbols. For more details on the band positions and assignments, refer to the Methods.