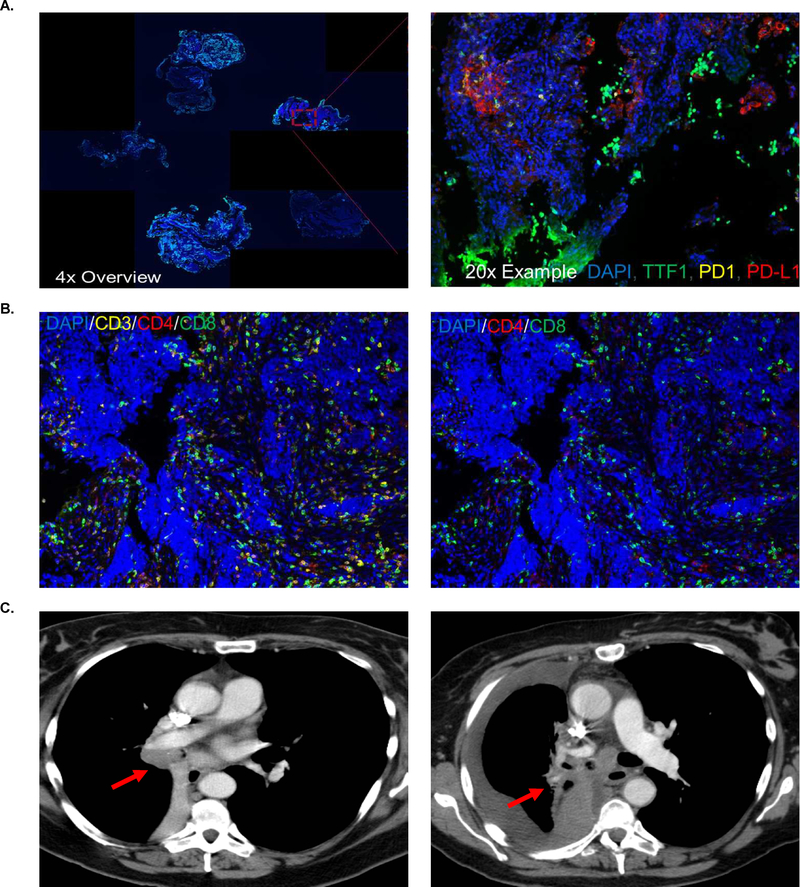
Figure 3. Immunologic correlates by automated quantitative analysis with accompanying computed tomography.
(A) 4x and 20x, DAPI in blue, TTF-1 in green, PD-1 in yellow, and PD-L1 in red. (B) 20x, DAPI in blue, CD3 in yellow, CD4 in red, and CD8 in green, first image with CD3 present, second image with CD3 removed. (C) Computed tomography demonstrates the primary tumor at diagnosis (left panel) followed by progression of disease (right panel)(red arrow indicates primary tumor in both panels).

