
Figure 1 –
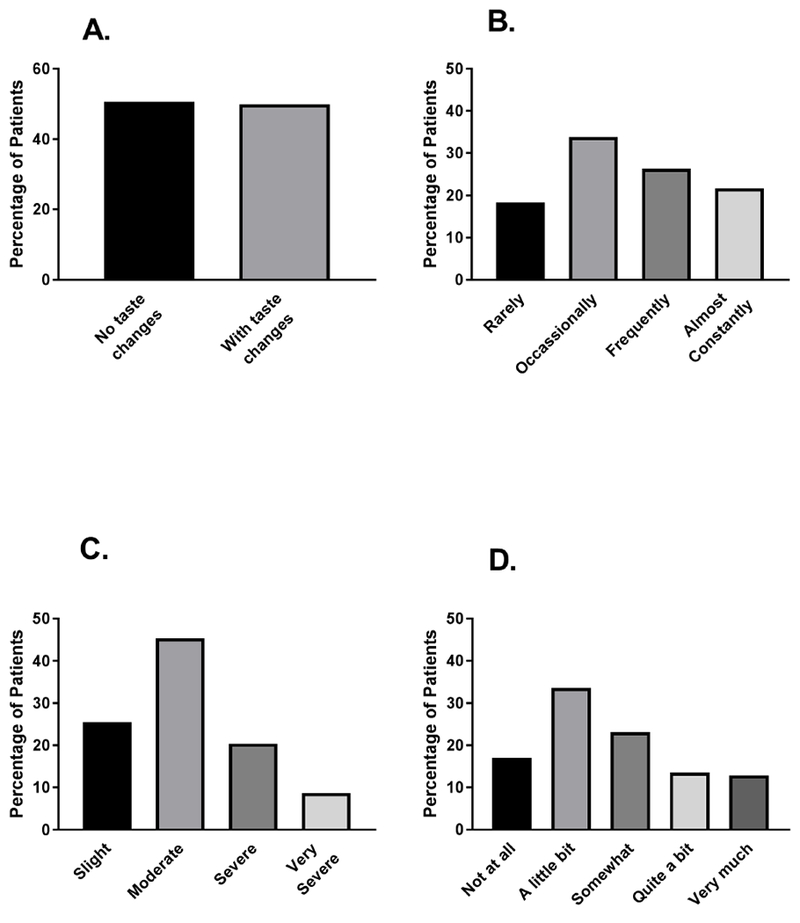
Percentages of patients with and without self-reported change in the way food tastes (CFT, A) and distribution of patients’ ratings of frequency (B), severity (C), and distress associated with CFT.
Official websites use .gov
A
.gov website belongs to an official
government organization in the United States.
Secure .gov websites use HTTPS
A lock (
) or https:// means you've safely
connected to the .gov website. Share sensitive
information only on official, secure websites.
Percentages of patients with and without self-reported change in the way food tastes (CFT, A) and distribution of patients’ ratings of frequency (B), severity (C), and distress associated with CFT.