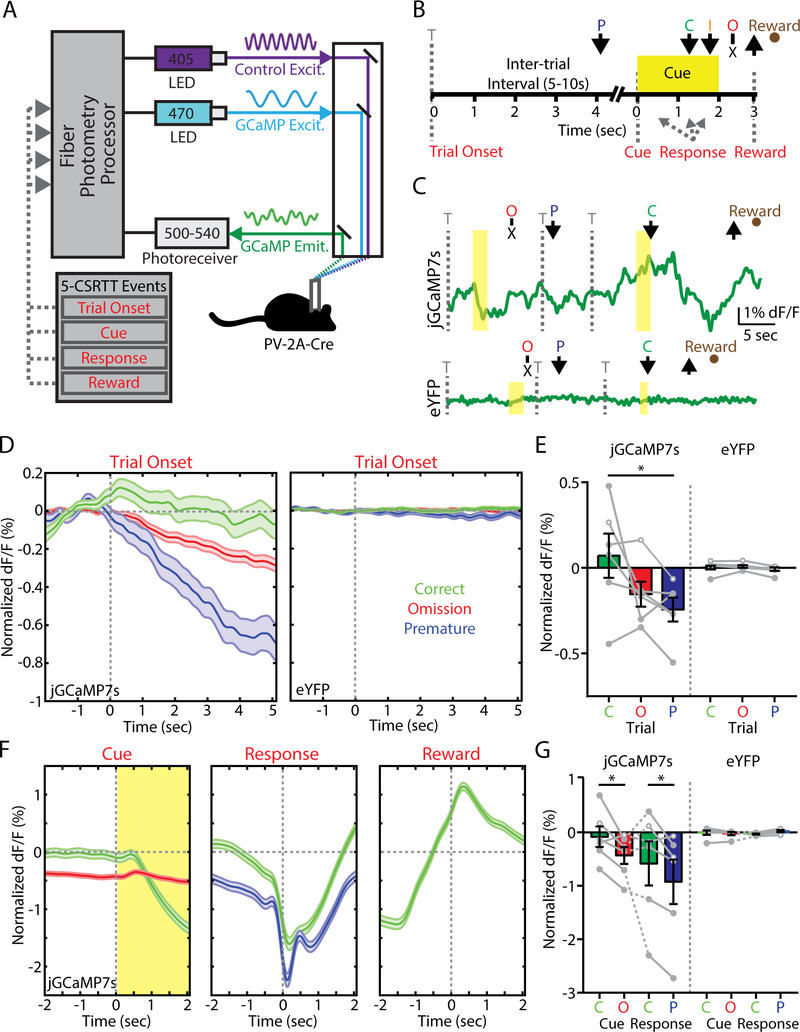
Figure 3. Fast-spiking interneuron (FSI) activity within the nucleus accumbens (NAc) core predicts trial outcome in the 5-choice serial reaction time task (5-CSRTT).
(A) Fiber photometry setup for in vivo monitoring of jGCaMP7s expressed by FSIs during the 5-CSRTT. (B) Timeline of the 5-CSRTT, including events for fiber photometry analysis. Arrows indicate nose poke response. T, trial onset; P, premature; C, correct; I, incorrect; O, omission. (C) Example fiber photometry signal across various trial types in PV-2A-Cre mice expressing (top) jGCaMP7s or (bottom) eYFP. (D) Fiber photometry signal aligned to trial onset for mice expressing (left) jGCaMP7s (trials: correct, 919; premature, 425; omission, 4871) or (right) eYFP (trials: correct, 1336; premature, 305; omission, 3697). (E) Fiber photometry data averaged within animal for jGCaMP7s (mice: n = 6: 3 male, 3 female) or eYFP (mice: n = 6: 3 male, 3 female). (F) Fiber photometry signal from mice expressing jGCaMP7s aligned to (left) cue, (middle) nose poke response, or (right) magazine entry for food reward. (G) Fiber photometry data averaged within animal. Bar graphs represent normalized dF/F values averaged over two seconds following (trial onset) or prior to (cue, response) each aligned event. *p<0.05, LSD post-hoc test.

