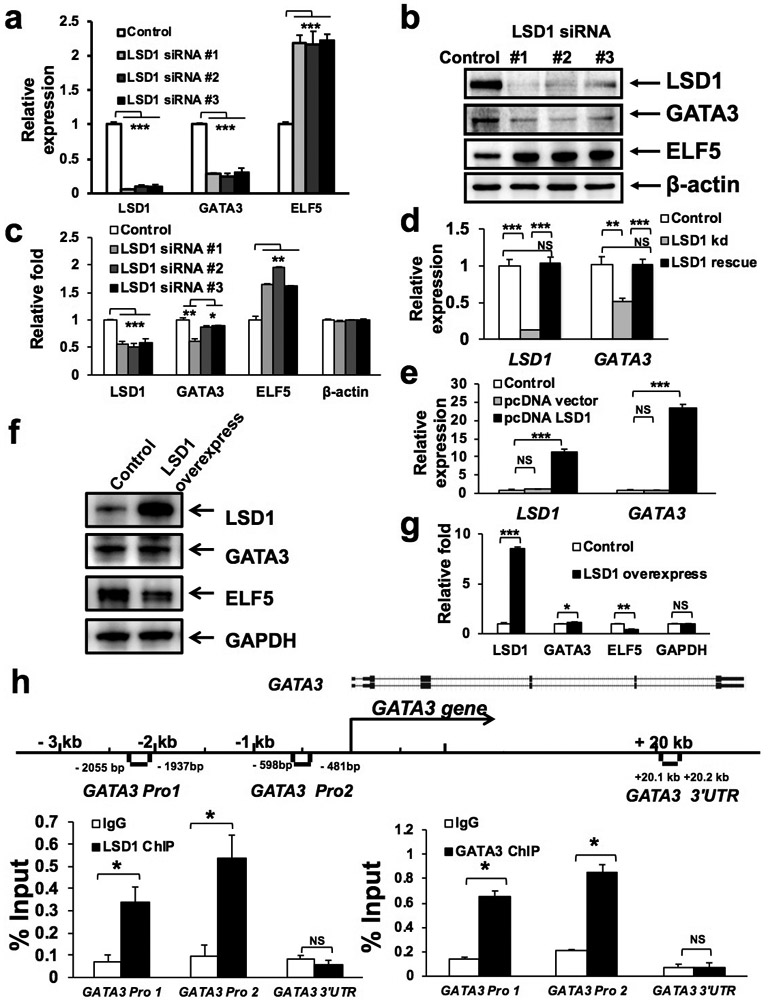
Figure 4. LSD1 positively regulates GATA3 expression.

(a-b) qRT-PCR (a) and Western blotting (b) analyses showing downregulation of GATA3 and upregulation of ELF5 in MCF7 cells upon knockdown of LSD1 using three different siRNAs. Data represent mean ± SEM. P-values: Student t-test (2-sided), n=3, *** indicates P<0.001.
(c) Quantification for (b). Data represent mean ± SEM. P-values: Student t-test (2-sided), n=3, * indicates P<0.05, ** indicates P<0.01, *** indicates P<0.001.
(d) qRT-PCR analysis showing restoration of GATA3 expression in MCF7 cells with LSD1 knockdown, upon co-transfection with a LSD1 rescue construct resistant to the LSD1 siRNA. Data represent mean ± SEM. P-values: Student t-test (2-sided), n=3, * indicates P<0.05, ** indicates P<0.01, *** indicates P<0.001, NS: not significant.
(e-f) qRT-PCR (e) and Western blotting (f) analyses showing increased expression of GATA3 in MCF7 cells upon overexpression of LSD1. Data represent mean ± SEM. P-values: Student t-test (2-sided), n=3, *** indicates P<0.001, NS: not significant.
(g) Quantification for (f). Data represent mean ± SEM. P-values: Student t-test (2-sided), n=3, * indicates P<0.05, ** indicates P<0.01, *** indicates P<0.001, NS: not significant.
(h) ChIP with anti-LSD1 (left) or anti-GATA3 (right) antibody in MCF7 cells, followed by PCR with primers specific to either the GATA3 promoter (Pro1, 2) region or its 3’ untranslated region (UTR), as indicated in the schematic diagram (for the GATA3 gene). Data represent mean ± SEM. P-values: Student t-test (2-sided), n=3, * indicates P<0.05, ** indicates P<0.01, *** indicates P<0.001, NS: not significant.
