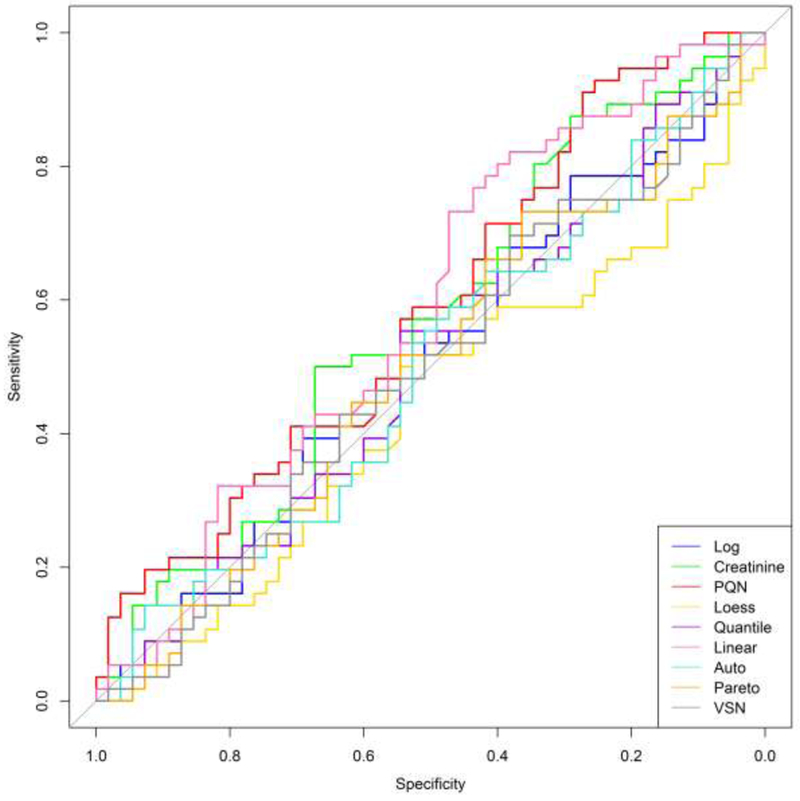
Figure 3.

Prostate cancer ROC curves for each normalized data set. The horizontal axis displays the specificity (true negative rate) while the vertical axis represents the sensitivity (true positive rate). ROC curves for each normalization technique are shown with different colors.
