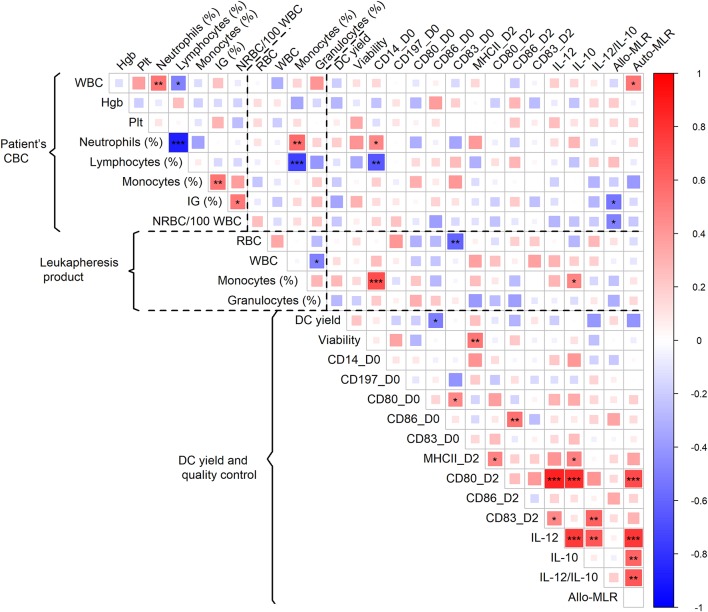
Figure 2.
Association of patient CBC prior to monocyte harvest and parameters of leukapheresis product with DC yield and quality control. Red color represents a positive correlation and blue color a negative correlation; strength of relationship is represented by size of square and intensity of color—larger squares with intense color have a stronger association; *p < 0.05, **p < 0.01, ***p < 0.001.

