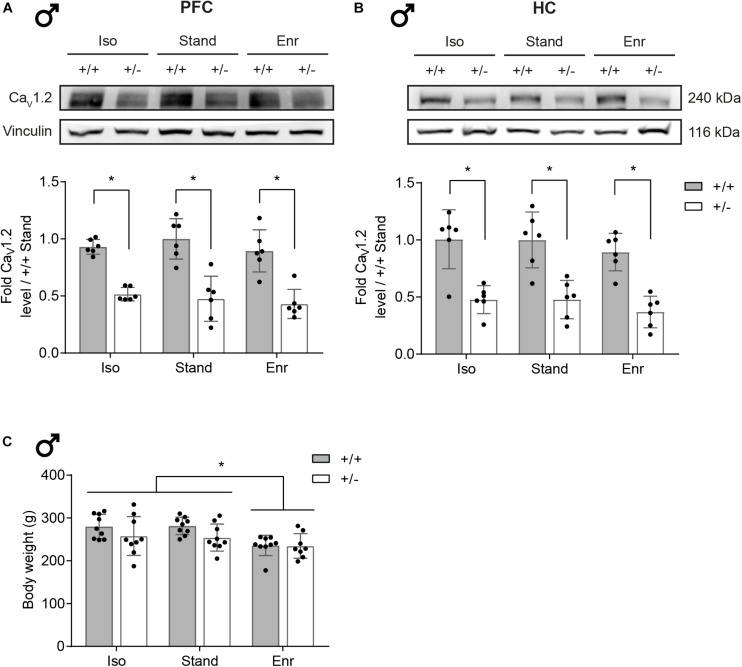
FIGURE 2.
CaV1.2 protein levels in rat brain and body weight. CaV1.2 protein expression levels in the right prefrontal cortex and hippocampus of 2-month-old male Cacna1c+/– rats and Cacna1c+/+ littermate controls from the different environmental conditions were analyzed by Western blot. (A) One representative immunoblot per brain area is shown. (B) The bar graphs were obtained by densitometric quantification of the Western blot data. The values are normalized to the loading control vinculin and presented as fold of Cacna1c+/+-Stand (mean ± SD, n = 6). (C) Whole body weight was determined after the 4-week exposure to the experimental housing conditions at ∼2 months of age (mean ± SD, n = 8–9). Statistical significance is highlighted by an asterisk (∗). +/+, wildtype Cacna1c+/+; + /−, heterozygous Cacna1c+/–; Iso, isolation; Stand, standard housing; Enr, enrichment.

