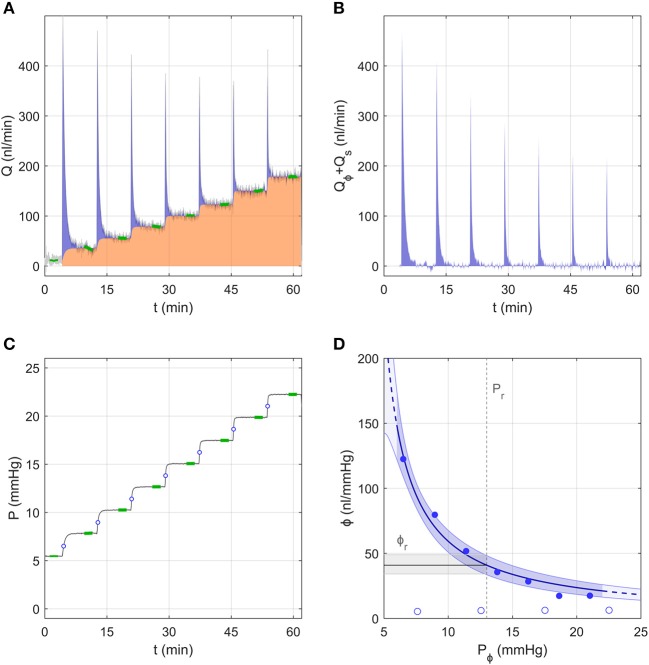
Figure 3.
A representative data sample to demonstrate the analysis using the Discrete Volume Method. (A) The measured flow rate Q over 7 increasing pressure steps in an untreated mouse eye. Green highlights indicate the stable flow rate for each step. The area shaded in orange represents the volume passing through the outflow pathway, while the blue shaded area represents the “filling volume” that goes into expanding the system and tubing compliances (see text). (B) The flow rate tracing from panel a corrected to show only the component that enters the combined compliance of the system and eye, defined as Qϕ + Qs = Q − Qr (see Figure 1B). (C) The measured pressure tracing for the same experiment shown in panel a, with green highlights indicating the stable pressure for each step. Open circles indicate the value of Pϕ,j at each step. (D) Ocular compliance, ϕ, plotted against pressure (filled circles). Blue curve represents the best fit by Equation (3), along with 95% confidence bounds (in blue shading). Black line and grey shading represent the estimated reference compliance, ϕr, and its 95% confidence interval at a reference pressure, Pr, of 13 mmHg (dashed vertical line). Open circles represent system compliance measured over a sequence of similar pressure steps prior to the ocular measurement.

