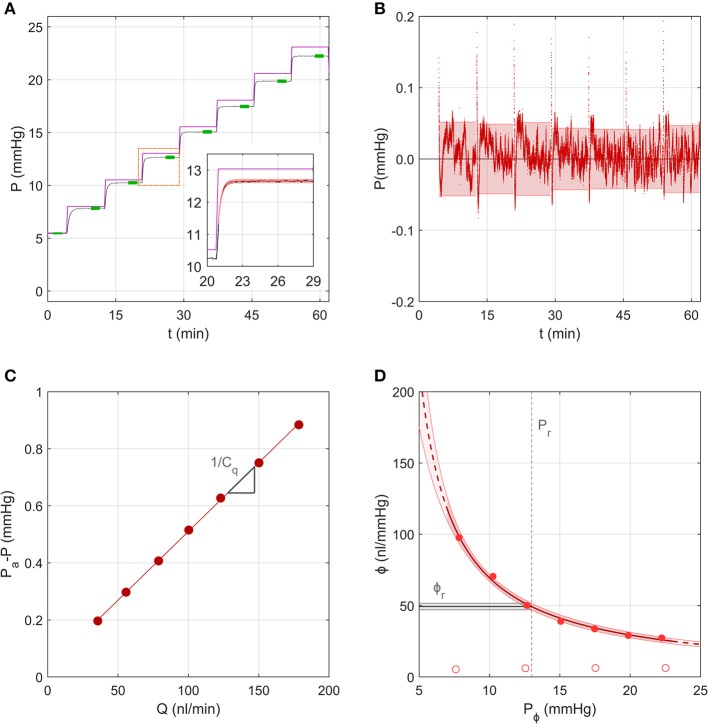
Figure 4.
A representative sample to demonstrate the analysis using the Step Response Method, using data from the same experiment shown in Figure 3. (A) The measured pressure P over 7 increasing pressure steps in an untreated mouse eye (black tracing; data repeated from Figure 3C). Purple line shows the applied pressure, Pa. Green highlights indicate the stable pressure for each step. Inset shows pressure data from a single step (black tracing) fit by the analytical model (red shading) given by Equations (8)–(10). (B) Residuals between the model fit and pressure tracing over all steps, with 95% confidence intervals on the residual for each step indicated by the shading. (C) Pressure drop across the capillary and flow sensor plotted vs. the measured flow rate, with a linear fit according to Equation (14) yielding estimated values of the slope (1/Cq, see section Calculation of Ocular Compliance using the Step Response Method for details). (D) Ocular compliance, ϕ, plotted against pressure, Pϕ (filled circles). Red curve represents the best fit by Equation (3), along with 95% confidence bounds (in red shading). Black line and grey shading represent the estimated reference compliance, ϕr, and its 95% confidence interval at a reference pressure, Pr, of 13 mmHg (dashed vertical line). Open circles represent system compliance reproduced from Figure 3D.

