Figure 5.
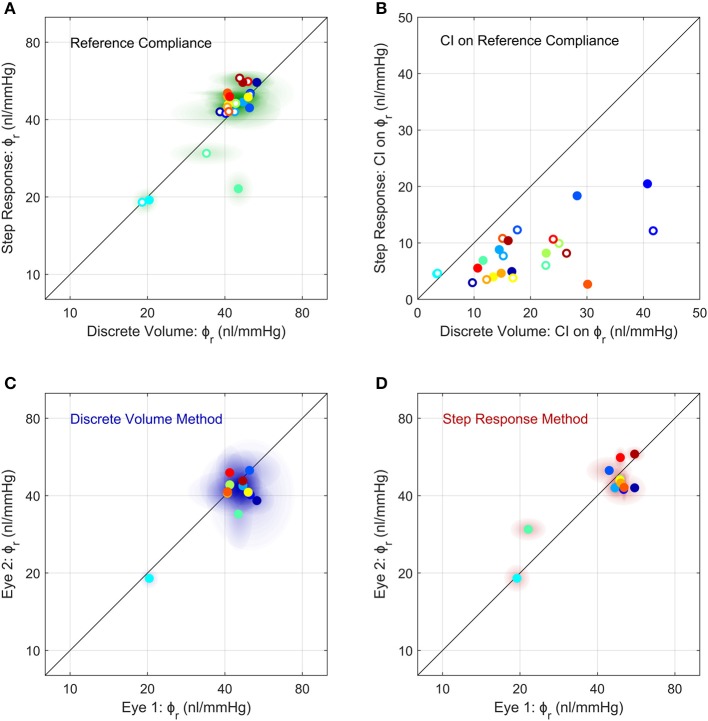
Comparison of the measurements of ocular compliance between the two methods (A,B) and between contralateral eyes (C,D). (A) The reference ocular compliance, ϕr, calculated by the Step Response Method plotted against that calculated by the Discrete Volume Method. Each data point represents an individual eye (N = 24) from 12 mice (separate colours), with filled vs. open circles identifying the two eyes from a given mouse. Shaded regions surrounding each data point represent the 95% confidence intervals on each estimate of ϕr. Figure S4 shows a Bland-Altman plot of the same data. (B) The 95% confidence intervals on the estimated values of ϕr shown in panel a, using the same colour scheme as (A). (C,D) A comparison of ϕr between contralateral eyes measured using the Discrete Volume Method (C) and Step Response Method (D). Each data point represents an individual mouse, with ϕr from contralateral eyes plotted on each axis. Shading represents 95% confidence intervals. The colour scheme is the same as in (A,B). The unity line, representing exact parity, is shown in black for each panel.

