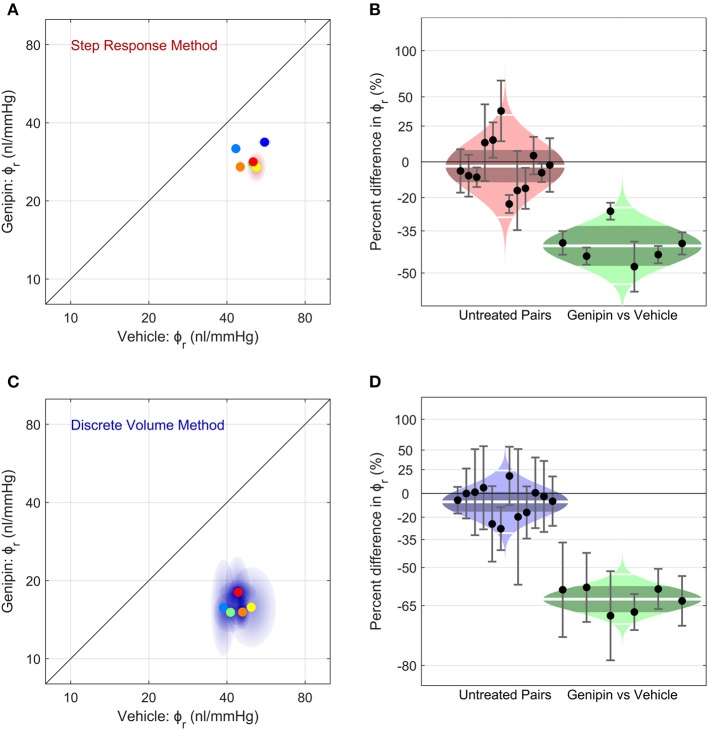
Figure 6.
The effect of corneoscleral stiffening on ocular compliance using (A,B) the Step Response Method or (C,D) the Discrete Volume Method. (A,C) Scatter plots, showing the reference ocular compliance, ϕr, measured in the genipin-treated eye plotted against that measured in the contralateral vehicle-treated eye, calculated by the Step Response Method (A) or the Discrete Volume Method (C). Each data point represents an individual mouse (N = 6; separate colours) and shaded regions represent the 95% confidence interval on each estimated value of ϕr. The unity line (black) represents exact parity between contralateral eyes. (B,D) Cello plots, showing the relative difference in ϕr between untreated contralateral eyes (left; N = 12 pairs) and between genipin-treated and vehicle-treated contralateral eyes (right; N = 6). For the untreated pairs (reproduced from Figure 5), there was no significant difference in ϕr between contralateral eyes using either the Step Response (p = 0.52) or Discrete Volume Method (p = 0.09). In contrast, for genipin treated eyes, there was a significant difference in ϕr relative to the vehicle-treated contralateral eye using either the Step Response (p = 0.0001) or Discrete Volume Method (p < 10−5). Shaded regions represent the best log-normal distribution that fits the data. The central white line represents the geometric mean, while the darker shading represents the 95% confidence interval on the geometric mean. The outer white lines on each distribution represent the limits encompassing 95% of the data. Data points represent the relative difference for an individual mouse, while the error bars represent the 95% confidence interval on that measurement.

