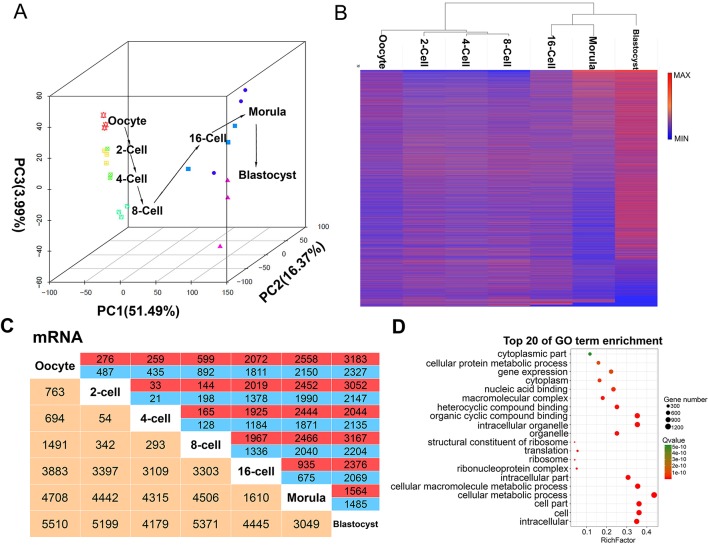
Figure 2.
mRNA expression patterns during pre-implantation development in the goat. (A) Principal component analysis (PCA) of mRNAs in 21 goat pre-implantation development samples at 7 different stages. The same color represents the same stage. The arrows indicate the direction of development between successive muscle stages. (B) Hierarchical clustering heat map of mRNAs by sample. Red, relatively high expression; blue, relatively low expression. (C) Number of differentially expressed mRNA showing up- (red) or down- (blue) regulation during development. Yellow, total number of differentially expressed mRNAs between any two stages. (D) Top 20 enriched GO terms for the differentially expressed mRNA between the 8- and 16-cell stage.

