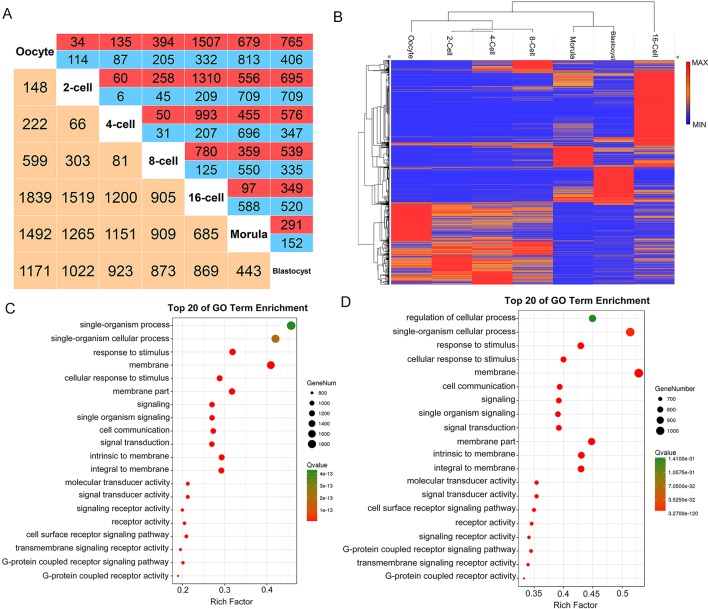
Figure 4.
LncRNA expression patterns during pre-implantation development in the goat. (A) Number of differentially expressed lncRNAs (DELs) showing up- (red) or down- (blue) regulation during development. Yellow, total number of DELs between any two stages. (B) Hierarchical clustering heat map of DELs by samples. Red, relatively high expression; blue, relatively low expression. (C–D) Top 20 enriched GO terms for the DELs between the 8- and 16-cell stage, and between the oocyte and 2-cell stage, respectively. Green, relatively high expression; red, relatively low expression.

