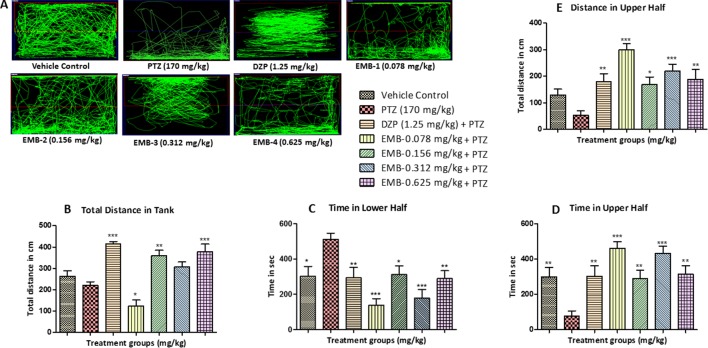
Figure 3.
Locomotor pattern and behavior analysis of embelin treatment against pentylenetetrazole (PTZ) induced seizures: (A) represents the tracking pattern of locomotor behavior for the control and PTZ treated and EMB treated groups. (B) represents the total distance traveled by fish in each group during locomotor behavior tracking. (C, D) represent the time spent in total by each fish in the lower and upper half of the behavior tank. (E) represents the total distance traveled in the upper half of the tank. The data are represented as mean ± SEM, n = 10, and statistically analyzed by one-way ANOVA followed by Dunnett’s test *P ≤0.05, **P ≤ 0.01, and ***P ≤ 0.001.

