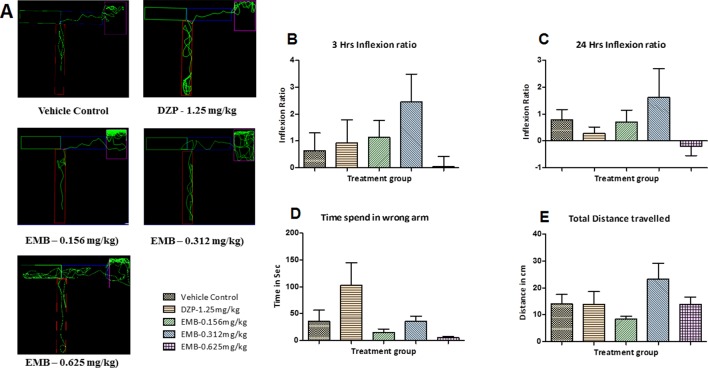
Figure 5.
T-maze tracking pattern and behavior analysis of embelin treatment in adult healthy zebrafish: (A) represents the T-maze tracking pattern of locomotor behavior for the control and DZP treated and embelin (EMB) treated groups. (B, C) represent the graph plot of the inflection ratio at 3 and 24 h. T-maze trail in adult healthy zebrafish. (D, E) represent the time spent in the wrong arm and total distance traveled by each fish to reach the deeper chamber of the T-maze in adult healthy zebrafish. Data are represented as mean ± SEM, n = 8, and statistically analyzed by one-way ANOVA followed by Dunnett’s test.

