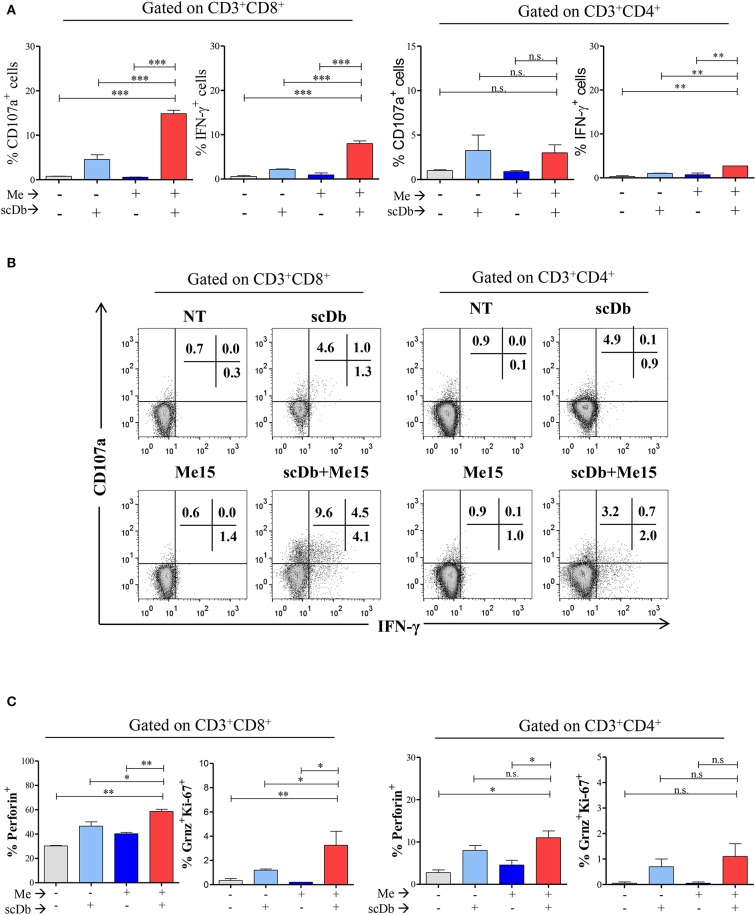
Figure 6.
ScDb triggering of PBL lytic machinery. (A) Increased frequency among CD3+/CD8+ and CD3+/CD4+ T lymphocytes of CD107a+ or IFN-γ+ cells after treatment with 0.1 μg/mL scDb in the presence or absence of a melanoma target cell line (Me15) at E:T 5:1. The graphs represent the mean ± SD of three experiments. (B) Surface expression of CD107a and intracellular staining for IFN-γ by flow cytometry in CD3+/CD8+ (left) and CD3+/CD4+ (right) T-cell subsets after treatment with 0.1 μg/mL scDb in the presence or absence of the Me15 melanoma target cell line. (C) Frequency among CD3+/CD8+ (left graphs) and CD3+/CD4+ (right graphs) T lymphocytes of perforin, granzyme B and Ki-67 expression, after treatment with 0.1 μg/mL scDb in the presence or absence of a melanoma target cell line (Me15) at E:T 5:1. The graphs represent the mean ± SD of three experiments. Statistical analysis in (A,C) by one-way ANOVA followed by Tukey's post-test. *p < 0.05, **p < 0.01, ***p < 0.001; ns: not significant.

