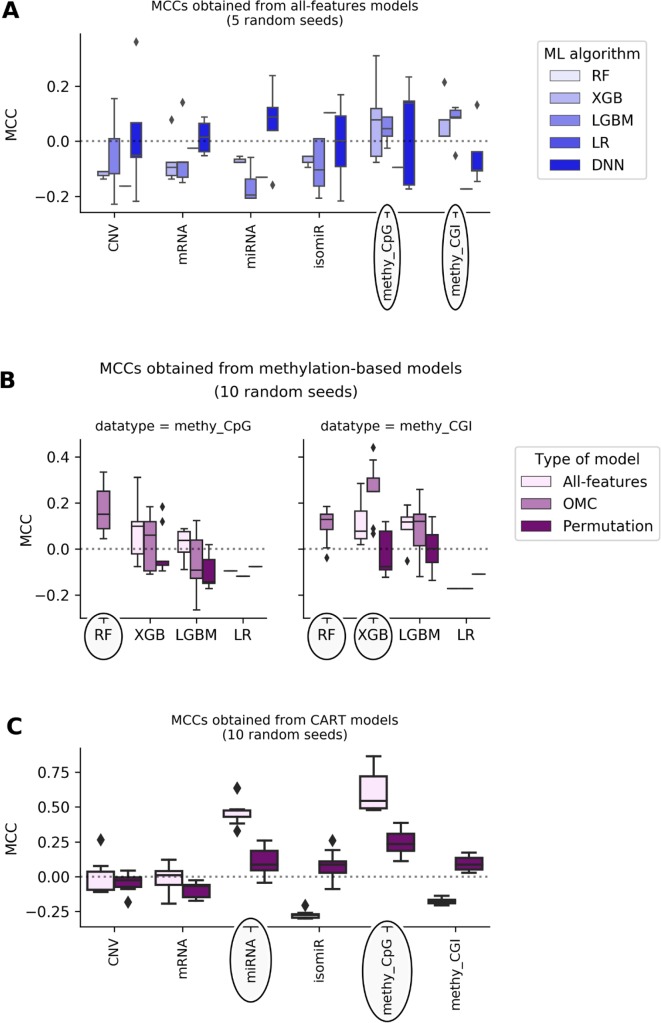
Figure 1.
DNA methylation and miRNA expression lead to the most predictive ML models. Each MCC of a given model is calculated by LOOCV. The experiment is repeated several times, each time with a different random seed, giving rise to a boxplot of MCCs for each case. Permutation models were generated after shuffling class labels on the considered training set. As RF models give undefined MCCs, blanks are found in bins where boxplots are expected. Substantial variability is observed, showing that this problem is both profile- and classification method-dependent. The dashed line shows the expected MCC from random classification. (A) Predictive performance of all-features models. All-features models are those in principle employing all the features in the profile to generate the prediction. Models are built with ML algorithms using the default operating threshold (0.5) to calculate the predicted class label from the predicted class probability. Five random seeds were set for each ML algorithm; thus, MCC values come from five runs of standard LOOCV. x-axis shows the employed molecular profile, while y-axis displays the MCCs obtained by classifiers. From the lightest to the darkest blue, boxplots summarize the distributions of MCCs obtained by XGB,LGBM, LR, and DNN models, respectively. Ellipses indicate which profiles employed by models obtain better-than-random predictive performance: DNA methylation profiles are the most predictive. This also suggests that the other profiles are less informative for the prediction of BC tumor response to paclitaxel. (B) Predictive performance applying OMC to methylation-based models. 10 random seeds were used to investigate further the most predictive profiles. OMC models had their hyperparameters complexity and operating threshold tuned and thus required nested LOOCV. Horizontal axes show the employed ML algorithms to process CpG site (left) and CGI (right) methylation datasets, while vertical axes display MCCs achieved by classifiers. Light-pink, medium-pink, and indigo boxplots summarize the distributions of MCCs obtained by all-features, OMC and permutations models, respectively. Circles indicate ML algorithms releasing models with predictive performance improved using OMC. This shows that predictive accuracy depends on both the molecular profile and the ML algorithm. Here, the best models found are CpG site methylation-based RF-OMC, CGI methylation-based RF-OMC, and CGI methylation-based XGB-OMC. (C) Predictive performance of CART models. These models (light-pink boxes) were built considering all features in the profile with no hyperparameter tuning. Permutation models (indigo boxes) were trained after that shuffling class labels in the training set. Each MCC is calculated by standard LOOCV, a process repeated with 10 different random seeds. x-axis shows the molecular profiles (‘CNV’ is short for copy-number variation, ‘methy_CpG’ for CpG site methylation, and ‘methy_CGI’ for CGI methylation), while y-axis displays the LOOCV MCCs achieved by each classifier. The dashed line shows the expected MCC from random classification. Ellipses indicate molecular profiles processed by CART models obtaining the highest predictive performance. These results reveal that CpG sites methylation-based and miRNA expression-based CART models are the most predictive. Predictive accuracy is substantially higher than that provided by all-features or OMC models (in A and B), which demonstrates that the CART learning algorithm is more suitable for these problem instances.

