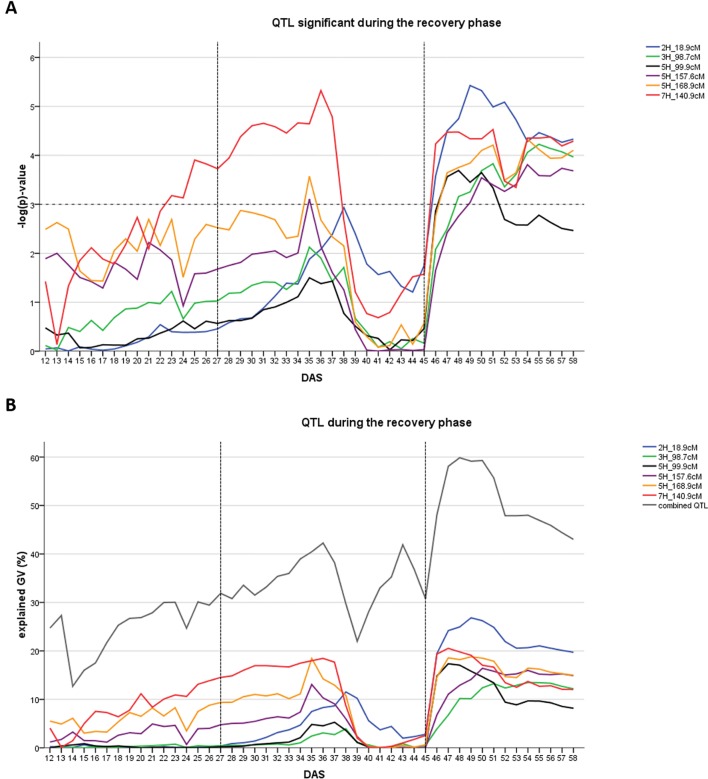
Figure 3.
Time dynamics of association of QTL significantly associated (FDR < 0.1) with digital biomass (DB) during the recovery phase in days after sowing (DAS). The drought stress phase from DAS 27 to DAS 45 is indicated by the two dashed vertical lines. (A) Significance value –log(p) over time for each QTL (SNP with the highest significance) in different colors. Arbitrary threshold of significance at –log(p)=3 is indicated by a dashed horizontal line. (B) Proportion of genetic variance explained by each QTL, represented in different colors and combined (all 12 QTL detected during the whole time-course of the experiment – drought and recovery period).

