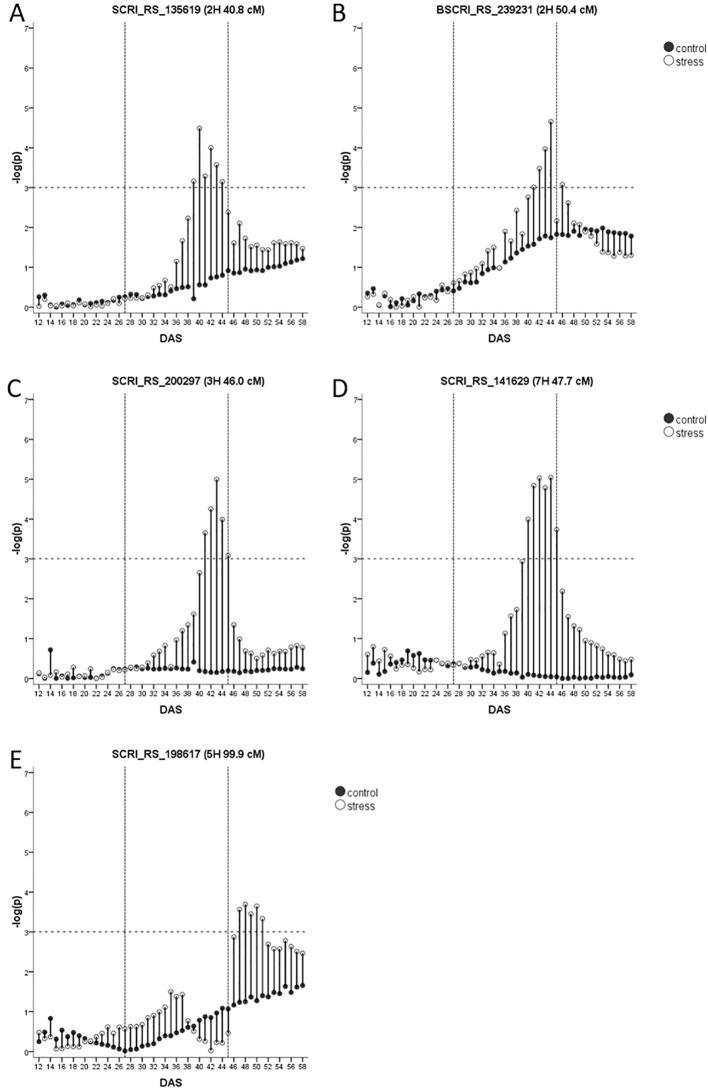
Figure 5.
(A–E) Drought-adaptive biomass QTL with their –log(p)-values over time in days after sowing (DAS) in drought stress (unfilled) and well-watered (black) conditions. Presented is only the most significant SNP of each QTL (in case it consists of several SNPs). As the FDR is calculated for each day and in each treatment separately, the general significance level of –log(p)-value = 3 is indicated by a dashed horizontal line. The drought stress phase from DAS 27 to DAS 45 is indicated by the two dashed vertical lines.

