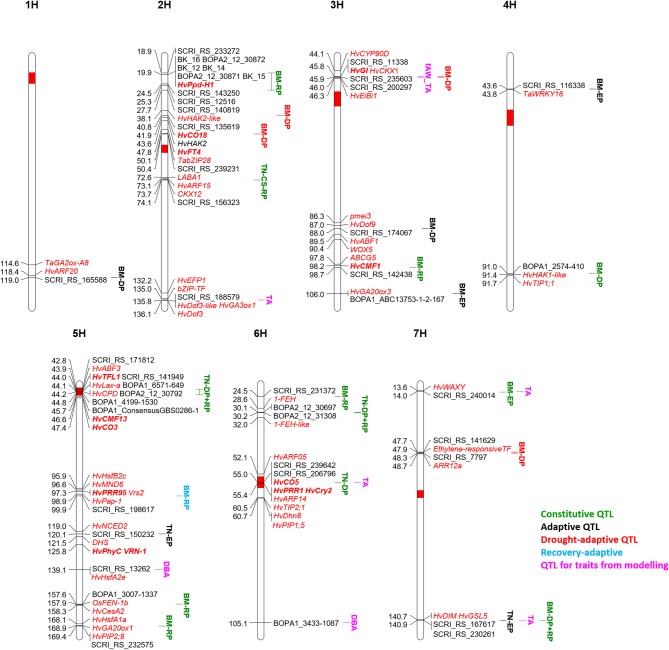
Figure 6.
QTL map of the seven barley chromosomes 1H to 7H for classification of biomass (BM) and tiller number (TN) QTL along with QTL for traits from drought-growth pattern modelling: biomass at time A (DBA), time A (TA) and fraction of available water at time A (fAW_TA). The time period of significance of each QTL is indicated in the QTL name: early growth phase (EP), drought phase (DP), recovery phase (RP). All potential candidate genes are given in red and italic, the flowering time genes are additionally highlighted in bold.

