Fig. 5.
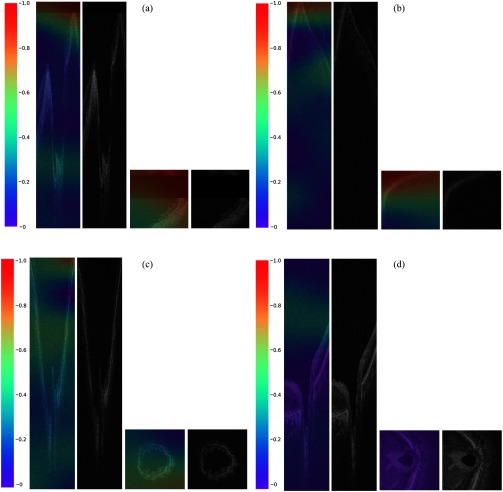
Examples of truly classified cases and the corresponding heatmaps generated by Grad-CAM. Referring to the color distribution of the color bar, the red-orange color represented more discriminative areas for ungradable information, which were of value 1 to 0.8, whereas the blue-purple color represented the nondiscriminative areas that were of value 0.2 to 0: (a) cross-sectional SDOCT B-scan and en-face SDOCT C-scan of an ungradable volume with signal loss; (b) cross-sectional SDOCT B-scan and en-face SDOCT C-scan of an ungradable volume with mirror artifact; (c) cross-sectional SDOCT B-scan and en-face SDOCT C-scan of an ungradable volume due to blurring; and (d) cross-sectional SDOCT B-scan and en-face SDOCT C-scan of a gradable volume. In general, for the truly discriminated ungradable volumes, the DLS could well detect ungradable features, especially signal loss, mirror artifacts, or blurriness, as illustrated in (a), (b), and (c). On the other hand, there was seldom warmer color in the truly discriminated gradable volumes, but relatively highlighted regions were mainly distributed in the vitreous or choroid, as illustrated in (d).

