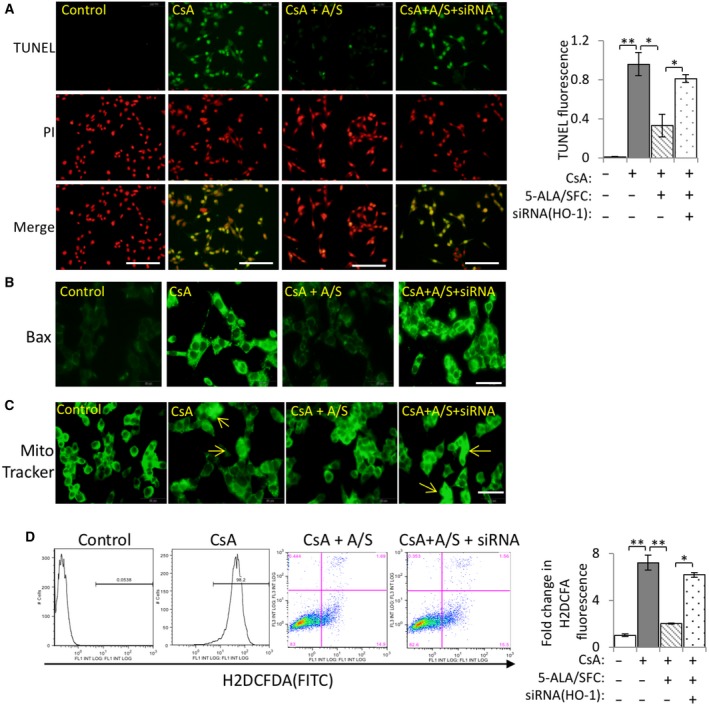
Figure 3.

Effects of 5‐ALA/SFC on CsA‐induced oxidative stress and apoptosis. (A) Representative immunofluorescence microscopy images of TUNEL (scale bar: 100 μm) and quantitative data on TUNEL‐positive fluorescence. (B) Bax expression was translocated to the mitochondria (scale bar: 50 μm). (C) Representative fluorescence images from MitoTracker (mitochondria for green fluorescence) (scale bar: 50 μm). (D) Representative and quantitative data on the cell levels of CM‐H2DCFDA in four groups were assessed. Data are expressed as the mean ± SD. Statistical significance was measured by Student's t‐test. Correlations were determined by Spearman's ranking (n = 3; *P < 0.05, **P < 0.01).
