Figure 6.

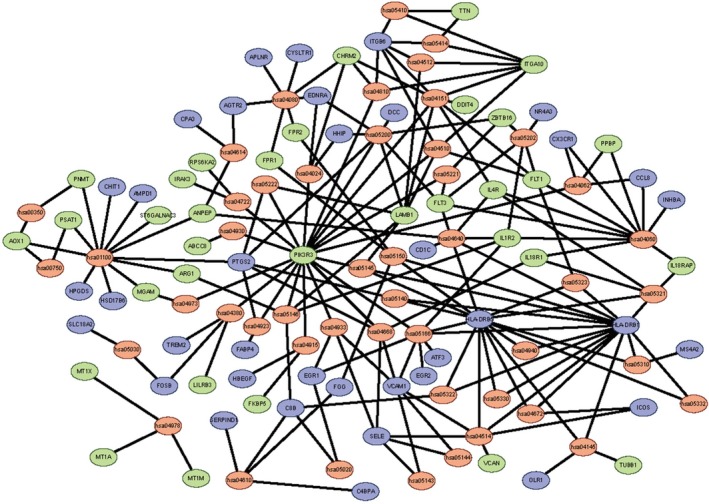
The significant KEGG pathways enrichment of DEGs. Green represents down‐regulated DEGs, blue represents up‐regulated DEGs and red represents the signaling pathway.

The significant KEGG pathways enrichment of DEGs. Green represents down‐regulated DEGs, blue represents up‐regulated DEGs and red represents the signaling pathway.