
Figure 9.
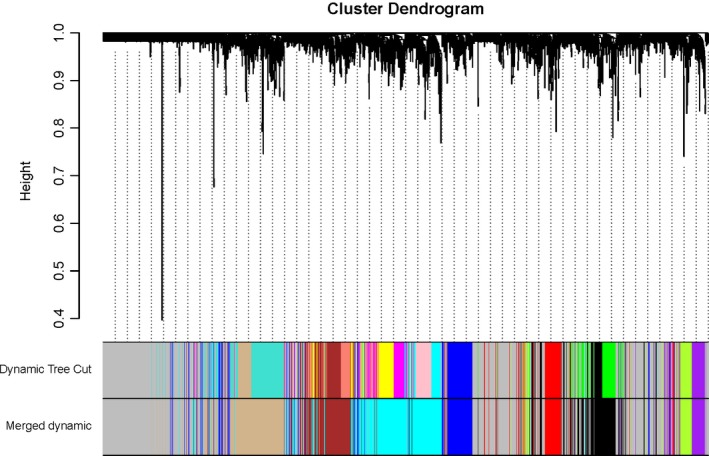
Network construction identifies distinct modules of coexpressed genes. The network was constructed using the lung tissue expression dataset of GSE27597 and GSE106986. The cluster dendrogram was produced by average linkage hierarchical clustering of genes using 1 − topological overlap as dissimilarity measure. Modules (Dynamic Tree Cut) and similarly merged modules (Merged dynamic) of coexpressed genes were assigned colors corresponding to the branches indicated by the horizontal bar beneath the dendrogram (merged cut height = 0.25).