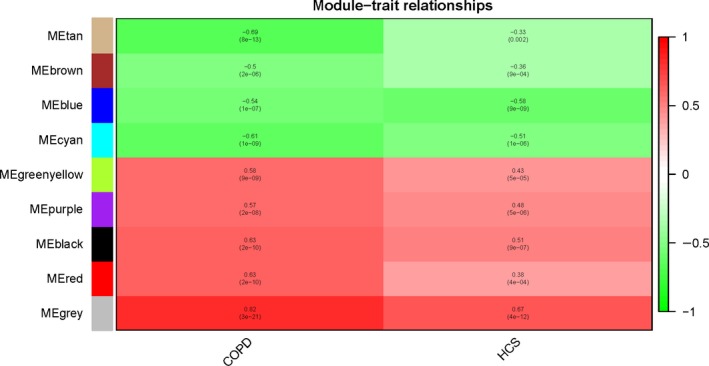
Figure 10.

wgcna heatmap. Using the default parameter setting and all DEGs (n = 2942), we identified nine gene modules using wgcna that were positively or negatively associated with COPD and smoking trait. Each row corresponds to a module eigengene and each column to a clinical trait (COPD and smoking status). Positive associations are red, and negative associations are green. HCS, history of smoking.
