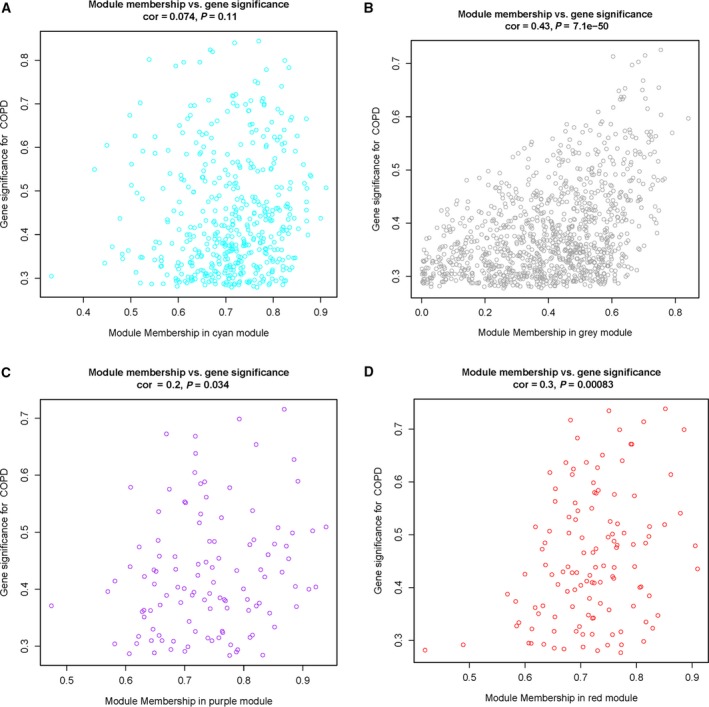
Figure 11.

COPD absolute GS versus MM. wgcna calculation of GS to COPD versus MM. In oversimplified terms, MM is a measure of how ‘tight’ genes cluster within the module, or mathematically, how close gene expression is to the module eigenvalue. A gene with high MM and GS identifies Hub genes that are both key components to the underlying BP and highly associated with the trait of interest. The GS for COPD was plotted. (A) Cyan represents MM. (B) Grey represents MM. (C) Purple represents MM. (D) Red represents MM.
