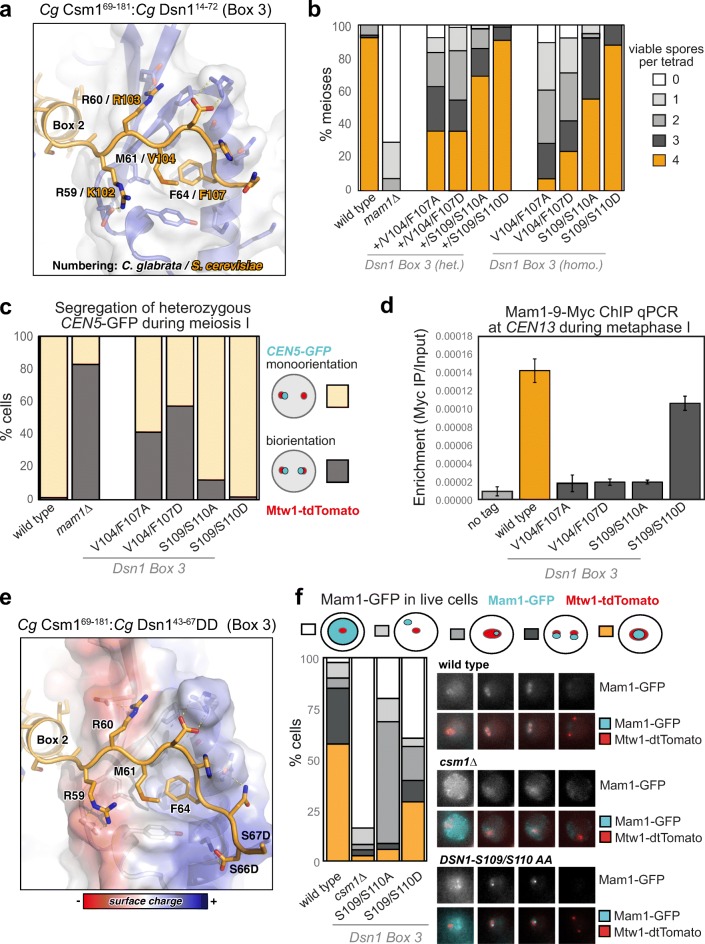
Fig. 4.
Dsn1 Box 3 residues are critical for meiosis. a Close-up view of the Cg Dsn1 Box 3 region (orange) interacting with the Csm1 conserved hydrophobic cavity (blue with white surface) in the Cg Csm169–181:Cg Dsn114–72 complex. Residue numbers shown are for Cg Dsn1, with Sc Dsn1 equivalents shown in orange text. See Fig. S5 g–i for equivalent views of the Cg Csm169–181:Sc Dsn171–110 and Cg Csm169–181:Cg Dsn143-67DD complexes; b Diploid cells with heterozygous or homozygous mutations in DSN1 were sporulated, dissected and the number of spores which grew up from each tetrad scored. Between 38 and 78 tetrads were dissected for each condition, from a minimum of two independent diploids. Data for wild type and mam1Δ is reproduced from Fig. 3b. Heterozygous diploids were generated from crosses between AMy1827 and AMy24652 (DSN1-V104A F107A), AMy1827 and AMy25110 (DSN1-V104D F107D), AMy1827 and AMy26803 (DSN1-S109A S110A), AMy1827 and AMy24744 (DSN1-S109D S110D). Homozygous diploids were generated from crosses between AMy24624 and AMy24652 (DSN1-V104A F107A), AMy24858 and AMy25110 (DSN1-V104D F107D), AMy26426 and AMy26803 (DSN1-S109A S110A), AMy24744 and AMy24688 (DSN1-S109D S110D); c Live cell imaging was used to score sister chromatid co-segregation during anaphase I in cells carrying heterozygous CEN5-GFP foci and Dsn1 Box 3 mutations as described in Fig. 3 c, d. Data for wild type and mam1Δ is reproduced from Fig. 3 d, other strains analysed and number of cells counted were AMy25762 (DSN1-V104A F107A) n = 51, AMy26475 (DSN1-V104D F107D) n = 61 and AMy26828 (DSN1-S109A S110A) n = 50, AMy27009 (DSN1-S109D S110D) n = 64; d Analysis of Mam1-9Myc association with a representative centromere (CEN4) by anti-Myc chromatin immunoprecipitation followed by quantitative PCR (ChIP-qPCR). Wild type (AM25617), DSN1-V104A F107A (AM24669), DSN1-V104D F107D (AMy26778), DSN1-S109A S110A (AMy26800) and DSN1-S109D S110D (AMy26476) cells carrying MAM1-9MYC were arrested in metaphase I of meiosis by depletion of Cdc20. Strain AMy8067 was used as a no tag control. Shown is the average from 8 biological replicates for wild type and no tag. The average from 3 experiments is shown for all DSN1 mutants with the exception of DSN1-S109D S110D where the average from 5 biological replicates is shown. Error bars indicate standard error; e Close-up view of the Cg Dsn1 Box 3 region with conserved serine residues mutated to aspartate (from the structure of Cg Csm169–181:Cg Dsn143–67DD). Residue D66 is visible forming hydrogen-bond interactions with Csm1 K172. The side-chain for residue D67 is disordered, and is modelled as alanine. Csm1 is shown in white with surface coloured by charge. f Live cell imaging of Mam1-GFP. Cells carrying Mtw1-tdTomato were released from a prophase block by β-oestradiol-dependent inducible expression of Ndt80 (Carlile and Amon 2008). Representative images are shown for the indicated genotypes. Graph displays the fraction of cells with the localisation pattern depicted in the schematic. Strains used were wild type (AMy14942; n = 40), csm1∆ (AMy15096; n = 37), DSN1-S109A S110A (AMy26963, n = 50), and DSN1-S109D S110D (AMy26947, n = 39)

