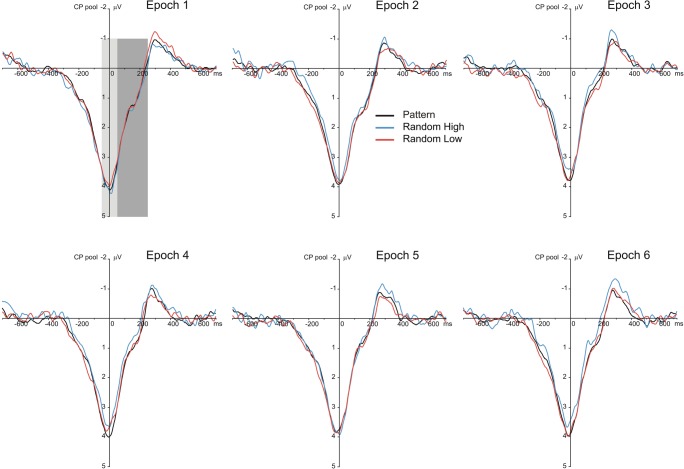
Fig. 5.
Response-locked P3 results suggesting sensitivity to the probability structure of the task. Grand average response-locked ERP waveforms over the centroparietal electrode pool are presented, displaying the P3 component for each epoch (1–6) and triplet type (pattern and random high-probability triplets and random low-probability triplets). The light-gray shaded area indicates the time window in which the P3 peak was quantified (−50–50 ms); the dark-gray shaded area indicates the time window in which the late P3 was quantified (50–250 ms). Zero ms indicates response onset

