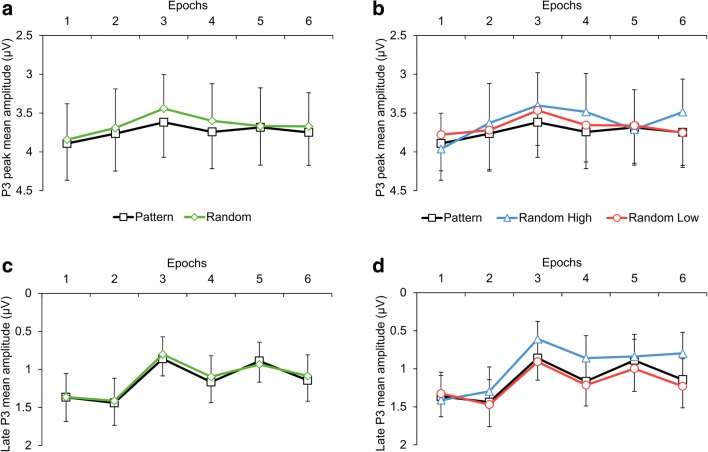
Fig. 7.
P3 mean amplitude results suggesting sensitivity to the probability structure of the task. Group-average P3 peak (a, b) and late P3 (c, d) mean amplitudes as a function of epoch (1–6) and triplet type (a, c: pattern vs. random triplets; b, d: pattern and random high-probability triplets and random low-probability triplets) averaged across stimulus-locked and response-locked segments are presented. Error bars denote standard error of mean

