
Figure 6.
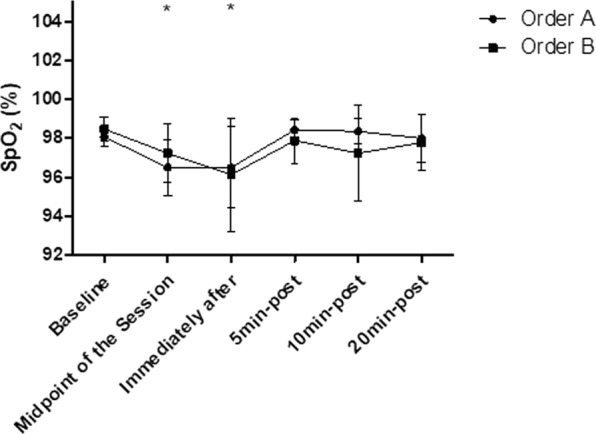
Mean and standard deviation of SpO2 values in comparison between different exercise orders. *Represents significant difference from the respective baseline.
Official websites use .gov
A
.gov website belongs to an official
government organization in the United States.
Secure .gov websites use HTTPS
A lock (
) or https:// means you've safely
connected to the .gov website. Share sensitive
information only on official, secure websites.
Mean and standard deviation of SpO2 values in comparison between different exercise orders. *Represents significant difference from the respective baseline.