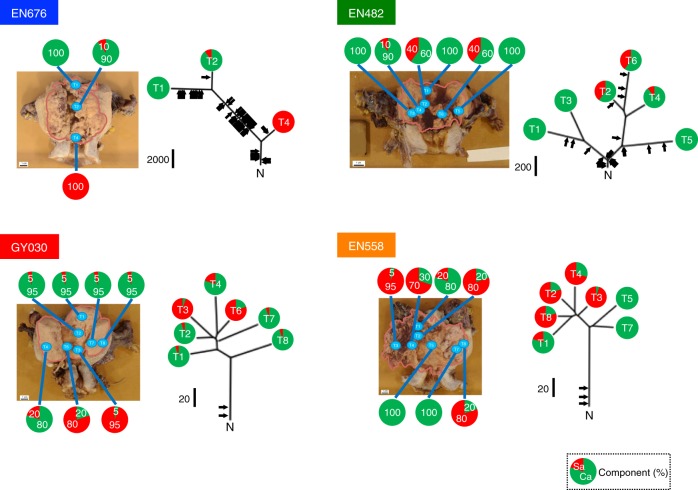
Fig. 6.
Phylogenetic tree analyses with SNVs and indels from the multi-regional exome-sequenced samples of uterine CSs. We selected representative tumors that were completely resected during surgery for each genomic aberration subtype (blue, POLE; green, MSI; red, CNH; and orange, CNL) and rendered to multi-regional exome sequencing. The phylogenetic tree (right) is presented alongside the entire tumor (left) with the margin shown as a pink line. The positions of sample collection are shown. Trunk/branch length is proportional to the total number of SNVs and indels. An index black bar beside the trunk indicates the number of base-pair mutations. The timing of driver mutation acquisition is shown with an arrow. Ca, carcinoma; Sa, sarcoma. The proportions of carcinoma and sarcoma components in each CS sample are shown as a pie chart, with green and red colors indicating the proportion of each component

