Fig. 7.
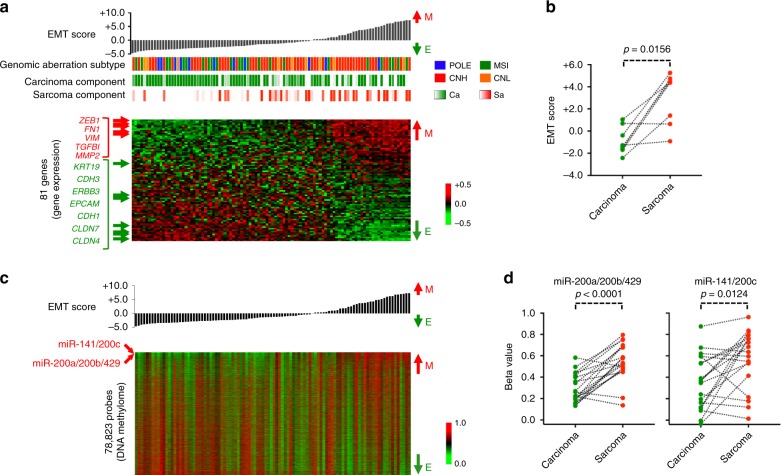
Epithelial-mesenchymal transition (EMT) in the transcriptome and DNA methylome of carcinosarcoma (CS) tumors. a Relationship among EMT score, EMT gene expression, genomic aberration subtype, and carcinoma or sarcoma content in a CS tumor. CS samples are sorted according to EMT score, calculated by the first principal component of 81 EMT marker genes. Red and green indicate high and low expression of the genes in the heatmap. Representative epithelial and mesenchymal genes are shown to the left of the heatmap in green and red, respectively. Color codes for the genomic aberration subtype are as follows: POLE, blue; MSI, green; CNH, red; and CNL, orange. Carcinoma and sarcoma content in a CS sample is shown by gradients of green and red, respectively. E; epithelial, M; mesenchymal. b EMT score of micro-dissected carcinoma or sarcoma components. The EMT scores were computed with RNA-seq data derived from the carcinoma and sarcoma components separately captured by laser capture microdissection. The Wilcoxon signed rank test was used to evaluate statistical significance. c DNA methylome correlated with EMT score across CS samples. CpG probes were selected by variable methylation within the top 20% variance. The resultant 78,823-probe β-values were sorted according to EMT score and are shown as a heatmap. The positions of CpG sites for miR-141/200c and miR-200a/200b/429 are indicated beside the heatmap in red. d miR-200a/200b/429 and miR-141/200c expression of micro-dissected carcinoma or sarcoma components. The Wilcoxon signed rank test was used to evaluate statistical significance

