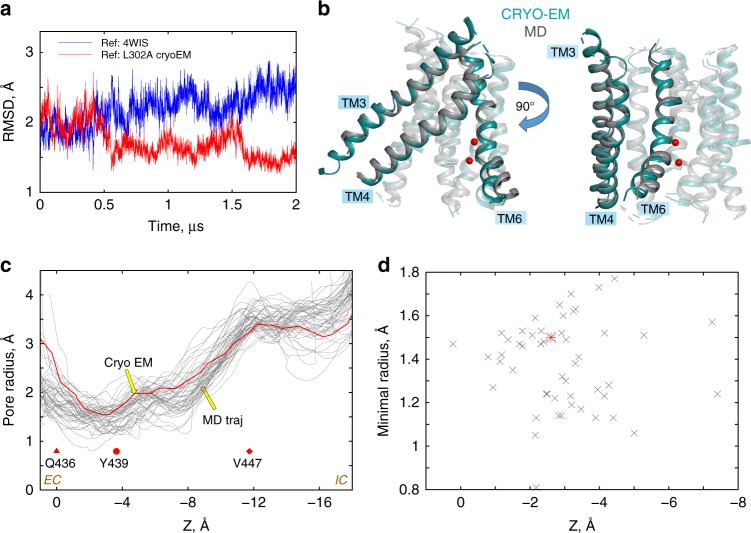
Fig. 8.
Structural similarity between the cryo-EM and computationally predicted models of the L302A nhTMEM16. a Time-evolution of the backbone RMSD of the TM helices for one monomer of the L302A nhTMEM16 from a 2 µs-long MD simulation (Supplementary Table 1) with respect to either the cryo-EM model of L302A nhTMEM16 (red), or the X-ray structure of the WT nhTMEM16 from PDBID: 4WIS7. b Superposition of the TM helices of L302A nhTMEM16 of the cryo-EM model (teal) with the average structure from the last 500 ns timeframe of the MD trajectory (gray). The backbone atom RMSD over all 10 TM helices is 1.2 Å. TM3, TM4, and TM6 helices are opaque and labeled, whereas the rest of the TM-s are shown in transparent. The Ca2+ ions from the cryo-EM structure are shown as red sphere. c The pore radius as a function of position along an axis perpendicular to the membrane (channel coordinate) for the cryo-EM structure of L302A (red line), and for 50 evenly spaced frames from the last 500 ns of the 2 μs MD simulation of the L302A from (a) (gray lines). The EC and IC ends of the pore are indicated, and Z = 0 Å corresponds to the location of the Cα atom of residue Q436 (red triangle symbol), the dot marks the position of the Cα atoms of residue of Y439, and the diamond symbol that of V447. The calculations were performed with the program HOLE (http://www.holeprogram.org/). d Values of the minimal radius of the pore versus the value of the channel coordinate at which the pore radius is minimal. The calculations are from the HOLE profiles shown in (c) (the red colored data point corresponds to the minimum in the cryo-EM structure profile; see red line in (c))

