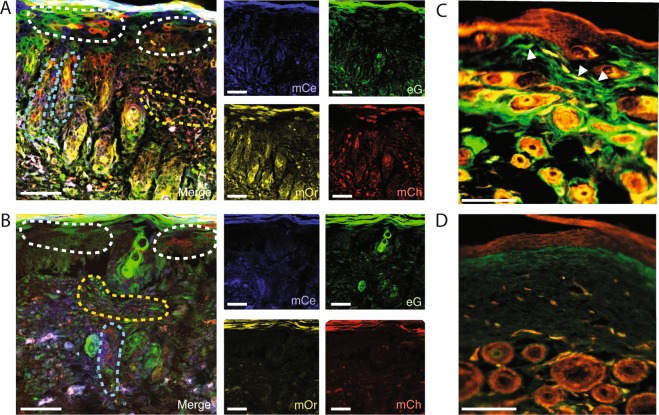
Figure 4.
(A) Polyclonal expansion of keratinocytes involved in wound coverage (outlined with white dotted line), hair follicles near the edge of the wound show polyclonal proliferation (examples outlined with blue dotted lines), fibroblasts involved in wound healing (example outlined in yellow dotted line), in a cleared dorsal wound tissue section from an Actin-CreERT2::Rosa26VT2/GT3 mouse harvested at post-operative day 14. Merged images at left, individual channels at right (mCe = membrane (m) Cerulean, mG = mGFP, mOr = mOrange, mCh = mCherry). Images (A,B) taken at 20X using an SP8 confocal microscope (working distance = 680 μm with oil immersion, NA = 0.75), scale bars represent 200 μm. (B) Non-cleared tissue section equivalent to 4 A. (C) Cleared En1-Cre::Rosa26mTmG peri-wound tissue. White arrowheads indicate En1-lineage dermal fibroblasts. Images (C,D) taken using a 20X objective using standard fluorescence microscopy (Leica DMI4000 B automated inverse fluorescence microscope), scale bars represent 150 μm. (D) Non-cleared En1-Cre::Rosa26mTmG peri-wound tissue equivalent to 4 C. Experiments conducted with n = 3 biological replicates per condition (where applicable), scale bars represent 200μm (unless otherwise indicated).

