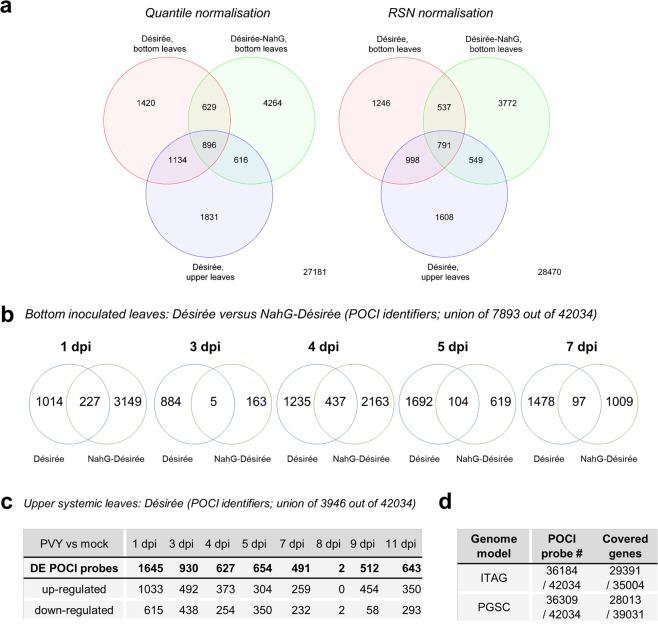
Fig. 4.
Comparison of transcriptomics responses in potato-PVY interaction through time. (a) Venn diagrams of differentially expressed (DE) genes in three different genotype/leaf type combinations (Désirée bottom, NahG-Désirée bottom and Désirée upper leaves) and for two normalisations (RNS and quantile). (b) Venn diagrams of differentially expressed (DE) genes in virus versus mock treated plants in bottom leaves of cv. Désirée and NahG-Désirée genotypes at 1, 3, 4, 5 and 7 dpi. (c) DE genes for upper non-inoculated leaves are shown for Désirée plants at 1, 3, 4, 5, 7, 8, 9 and 11 dpi. The values represent statistically significant differentially expressed genes as determined by empirical Bayes method (n = 3, FDR p-value < =0.05, |logFC| > =0.8). (d) Coverage of the two potato genome models (ITAG, PGSC) by the POCI microarray features.

