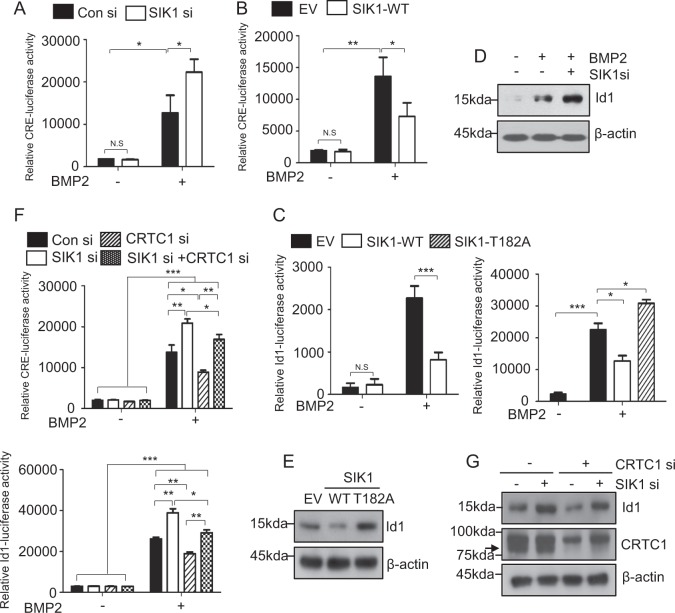
Fig. 5. The CREB/Id1 axis is a downstream target of SIK1.
a, b A CRE-luciferase reporter plasmid together with indicated siRNA or pcDNA3 plasmid were transfected to C2C12 cells. Cells were treated with vehicle or hBMP2 (150 ng/mL) for 12 h. Luciferase assay was performed with cell lysates. c An Id1 reporter together with pcDNA3, SIK1-WT, or SIK1-T182A plasmid were transfected to C2C12 cells. After treating with hBMP2 (150 ng/mL) for 12 h, cell lysates were subjected to luciferase assay. d, e C2C12 cells transfected with SIK1 siRNA or indicated SIK1 plasmid were treated with hBMP2 (150 ng/mL) for 18 h. The level of Id1 protein was determined by Western blotting. Relative Id1 band intensities are presented as histograms. f Primary preosteoblasts cotransfected with SIK1 siRNA and CRTC1 siRNA were stimulated with hBMP2 (150 ng/mL) for 12 h. CRE and Id1 luciferase assays were performed. g Primary preosteoblasts cotransfected with SIK1 siRNA and CRTC1 siRNA were stimulated with hBMP2 (150 ng/mL) for 18 h. Id1 protein levels were analyzed by Western blotting. The levels of Id1 and CRTC1 were normalized to β-actin. The arrow indicates the CRTC1 band below a nonspecific band. ***p < 0.001; **p < 0.01; *p < 0.05. N.S., not significant. t-test and one-away ANOVA

